Newsroom
Sorted by: Latest
-
Let’s Dance Returns to the Royal Ballet School With a Day of Free Classes for the Public
LONDON--(BUSINESS WIRE)--Following the success of last year’s inaugural event, The Royal Ballet School will again open its doors in Covent Garden to the public on Sunday 8 March as part of the UK’s Let’s Dance initiative. Spearheaded by Angela Rippon CBE, Let’s Dance is a national campaign born out of a simple idea – that dance has the power to transform lives. The one-day event is designed to get the nation moving and promote the physical, mental, and social benefits of dance through classes,...

-
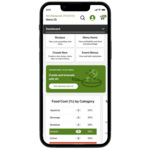
US Foods® Launches Menu IQ®: AI-Powered Tool Giving Restaurant Operators Real-Time Visibility Into Menu Profitability
ROSEMONT, Ill.--(BUSINESS WIRE)--US Foods Holding Corp. (NYSE:USFD), one of America’s largest food distributors and leader in digital foodservice solutions, today announced the launch of Menu IQ, an AI-powered profitability solution designed to help operators better manage food costs. Menu IQ transforms menu management from intuition into a data-driven strategy for optimizing menu profitability—at no additional cost to US Foods customers. Aligned with US Foods’ commitment to deliver more tools...
-
Giant Raises $8M to Build Interactive Storytelling for Kids
SAN FRANCISCO--(BUSINESS WIRE)--Giant, the interactive storytelling platform built around children as creators, today announced it has raised an $8 million seed round led by Matrix, Decasonic, and Griffin Gaming Partners, with participation from Perceptive Ventures, Flex Capital, Arbitrum Gaming Ventures, Unpopular Ventures, and LightShed Ventures. The funding will enable Giant to expand its interactive storytelling platform that allows children to become the stars of their own stories, talk to...
-
TAC InfoSec Limited Subsidiary CyberScope Web3 Security Announces Partnership with USDC Issuer Circle to Advance Secure, Compliant Stablecoin Infrastructure
NEW YORK--(BUSINESS WIRE)--TAC InfoSec Limited Subsidiary CyberScope Web3 Security Announces Partnership with USDC Issuer Circle to Advance Secure....
-
AST SpaceMobile Awarded $30 Million Prime Contract by U.S. Space Development Agency for HALO Europa Program
MIDLAND, Texas--(BUSINESS WIRE)--AST SpaceMobile, Inc. (“AST SpaceMobile”) (NASDAQ: ASTS), the company building the first and only space-based cellular broadband network accessible directly by everyday smartphones, designed for both commercial and government applications, today announced that it has entered into an agreement with the United States Space Development Agency (SDA) for the Europa Track 2 Commercial Solutions program. The agreement, executed under the Hybrid Acquisition for prolifer...

-
More Than 40 Organizations Urge Congress to Eliminate Failed CMMI Program
WASHINGTON--(BUSINESS WIRE)--Today, 42 organizations sent a letter to lawmakers urging Congress to eliminate the Center for Medicare and Medicaid Innovation....
-
Republic Bank Announces New Inclusion and Diversity Lead in Human Resources
LOUISVILLE, Ky.--(BUSINESS WIRE)--Republic Bank & Trust Company (“Republic” or the “Bank”) is proud to announce the promotion of Kenya Lacy to Associate Vice President, Inclusion and Diversity Manager. With more than 23 years of experience in banking operations including seven years at Republic Bank, Lacy brings a unique ability to align strategic business objectives with inclusive, people-centered leadership. Throughout her tenure, she has demonstrated a consistent track record of fosterin...

-
Lenovo erschließt das Potenzial von Daten mit der nächsten Generation KI-gesteuerter ThinkEdge-Lösungen
MORRISVILLE, North Carolina--(BUSINESS WIRE)--Lenovo™ hat sein ThinkEdge-Portfolio um eine neue Generation KI-gesteuerter Edge-Computing-Lösungen erweitert, darunter das kompakte und zuverlässige ThinkEdge SE10n Gen 2, das KI-fähige ThinkEdge SE30n Gen 2, das KI-Kraftpaket ThinkEdge SE60n Gen 2 und Lenovos erster industrieller All-in-One-Panel-PC (AIO), das ThinkEdge SE50a. Da Unternehmen Intelligenz immer näher an den Betrieb heranrücken, um die Ausfallsicherheit zu verbessern, Latenzen zu red...

-
City of Merced Selects HdL Companies for Business License Compliance and Tax Study Services
MERCED, Calif.--(BUSINESS WIRE)--HdL Companies has contracted with the City of Merced, California to provide Business License Compliance and Professional Services. The engagement focuses on compliance support to protect the City’s business license revenue stream. HdL’s Compliance services are designed to help identify unregistered businesses, support accurate reporting, address delinquencies, and promote fairness through a business-friendly, education-centric approach. As part of the agreement,...

-
Compliance Scorecard Introduces Governed, Audit-Ready AI for MSP Compliance
DOVER, N.H.--(BUSINESS WIRE)--Compliance Scorecard today announced the release of v10, introducing governed, audit-ready AI designed to support defensible compliance decision making for managed service providers (MSPs). Unlike traditional GRC platforms or ungoverned AI tools, Compliance Scorecard v10 applies AI only within a structured system of validated context and controls. The platform is built on a simple premise: AI can only be trusted in compliance if the required context already exists....