

Newsroom
Sorted by: Latest
-
First Trust Global Funds PLC UK Regulatory Announcement: Net Asset Value(s)
LONDON--(BUSINESS WIRE)-- Funds Date TIDM ISIN Code Shares in Issue Currency Net Asset Value NAV/per Share FIRST TRUST BLOOMBERG GLOBAL SEMICONDUCTOR SUPPLY CHAIN UCITS ETF 20.02.2026 CHPS.LN IE000KXTLDE2 700,002.00 USD 25,818,756.98 36.884 ...
-
Lumen Ratings Upgraded by Top 3 Global Ratings Agencies
DENVER--(BUSINESS WIRE)--Lumen Technologies (NYSE: LUMN) today announced that it has received upgraded ratings from all three major global ratings agencies – Fitch Ratings (Fitch), Moody’s Investor Service (Moody’s), and S&P Global (S&P) – marking a significant milestone in the company’s multi-year financial and operational transformation. “These upgrades validate the hard work of our teams and the structural progress we’ve made to strengthen our balance sheet and reposition Lumen for s...
-
First Trust Global Funds PLC UK Regulatory Announcement: Net Asset Value(s)
LONDON--(BUSINESS WIRE)-- Funds Date TIDM ISIN Code Shares in Issue Currency Net Asset Value NAV/per Share First Trust Indxx Global Aerospace & Defence UCITS ETF 20.02.2026 MISL.LN IE000NVDQXE1 3,375,002.00 USD 126,258,041.84 37.410 ...
-
First Trust Global Funds PLC UK Regulatory Announcement: Net Asset Value(s)
LONDON--(BUSINESS WIRE)-- Funds Date TIDM ISIN Code Shares in Issue Currency Net Asset Value NAV/per Share First Trust Vest Nasdaq-100 Moderate Buffer UCITS ETF - September 20.02.2026 QSEP.LN IE000FQ808R5 400,002.00 USD 9,143,786.25 22.859 ...
-
First Trust Global Funds PLC UK Regulatory Announcement: Net Asset Value(s)
LONDON--(BUSINESS WIRE)-- Funds Date TIDM ISIN Code Shares in Issue Currency Net Asset Value NAV/per Share First Trust Vest U.S. Equity Moderate Buffer UCITS ETF - May 20.02.2026 GMAY.LN IE000P0FL8E3 950,002.00 USD 36,708,386.18 38.640 ...
-
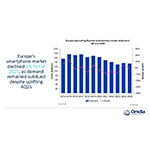
Omdia: Apple and HONOR Claim Record Market Shares as Europe’s Smartphone Shipment Dips 1% in 2025
LONDON--(BUSINESS WIRE)--The latest research from Omdia reveals that the European smartphone market declined by 1% in 2025 to 134.2 million units, marking the end of a disruptive year defined by subdued demand and new regulations requiring eco-design and USB-C. Samsung remained Europe’s largest smartphone vendor, with shipments marginally growing to 46.6 million units. After a slow 1H25 caused by the absence of the Galaxy A0x series, Samsung bounced back in 2H25, particularly by leveraging a di...
-
First Trust Global Funds PLC UK Regulatory Announcement: Net Asset Value(s)
LONDON--(BUSINESS WIRE)-- Funds Date TIDM ISIN Code Shares in Issue Currency Net Asset Value NAV/per Share First Trust US Momentum UCITS ETF 20.02.2026 FTMO.LN IE000CY30YV9 3,050,002.00 USD 86,280,652.55 28.289 ...
-
Samson Rock Capital LLP UK Regulatory Announcement: Form 8.3
LONDON--(BUSINESS WIRE)-- FORM 8.3 PUBLIC OPENING POSITION DISCLOSURE/DEALING DISCLOSURE BY A PERSON WITH INTERESTS IN RELEVANT SECURITIES REPRESENTING 1% OR MORE Rule 8.3 of the Takeover Code (the “Code”) 1. KEY INFORMATION (a) Full name of discloser: SAMSON ROCK CAPITAL LLP (b) Owner or controller of interests and short positions disclosed, if different from 1(a): The naming of nominee or vehicle companies is insufficient. For a trust, the trustee(s), settlor and beneficiaries must be named....
-
Merck Evolves Human Health Operating Structure to Support Portfolio Execution
RAHWAY, N.J.--(BUSINESS WIRE)--Merck Evolves Human Health Operating Structure to Support Portfolio Execution...
-
Samson Rock Capital LLP UK Regulatory Announcement: Form 8.3
LONDON--(BUSINESS WIRE)-- FORM 8.3 PUBLIC OPENING POSITION DISCLOSURE/DEALING DISCLOSURE BY A PERSON WITH INTERESTS IN RELEVANT SECURITIES REPRESENTING 1% OR MORE Rule 8.3 of the Takeover Code (the “Code”) 1. KEY INFORMATION (a) Full name of discloser: SAMSON ROCK CAPITAL LLP (b) Owner or controller of interests and short positions disclosed, if different from 1(a): The naming of nominee or vehicle companies is insufficient. For a trust, the trustee(s), settlor and beneficiaries must be named....