

Newsroom
Sorted by: Latest
-
The OneLegacy Donate Life Run/Walk and Family Festival Celebrates 24 Years of Inspiring Local Southern California Communities to Donate Life
LOS ANGELES--(BUSINESS WIRE)--OneLegacy, the non-profit organ procurement organization serving seven counties in Southern California, will host its 24th annual OneLegacy Donate Life Run/Walk and Family Festival at Azusa Pacific University this Saturday, April 25th, 2026. This signature community event brings together thousands of donor families, transplant recipients, living donors, and community partners for a powerful day of remembrance, hope, and action during National Donate Life Month. Pro...
-
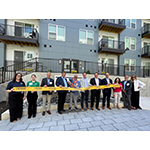
Ribbon-Cutting Celebrates JAG’s Amenity-Rich J Veridian Upper Dublin
FORT WASHINGTON, Pa.--(BUSINESS WIRE)--Local officials joined prominent East Coast developer Jefferson Apartment Group (JAG) and equity partner CP Capital to celebrate J Veridian Upper Dublin, an amenity-rich, 310-unit Class A community in Fort Washington, Pennsylvania. Located at 1125 Virginia Drive, the site of a former office park, the community comprises three 5-story buildings and 8 acres of walkable open space with a 1.4-mile trail connecting to the Cross County Trail. Upper Dublin Townsh...
-
AM Best to Exhibit at Target Markets Program Administrators Association Mid-Year Forum
OLDWICK, N.J.--(BUSINESS WIRE)--AM Best will exhibit at the upcoming Target Markets Program Administrators Association’s (TMPAA) Mid-Year Forum, which will take place April 28-30, 2026, in Dallas, TX. AM Best’s Meg Mulry, senior director-industry relations, and Brendan Tyne, director, from its business development team, will be available at booth 66 to discuss Best’s Credit Ratings and Best’s Performance Assessments for Delegated Underwriting Authority Enterprises (DUAE), Forum attendees intere...
-
SILA Stock Alert: Halper Sadeh LLC is Investigating Whether Sila Realty Trust, Inc. is Obtaining a Fair Price for its Shareholders
NEW YORK--(BUSINESS WIRE)--Halper Sadeh LLC, an investor rights law firm, is investigating the sale of Sila Realty Trust, Inc. (NYSE: SILA) to affiliates of Blue Owl Real Estate Capital LLC for $30.38 per share. Halper Sadeh encourages Sila Realty shareholders to click here to learn more about their rights and options or contact Daniel Sadeh or Zachary Halper free of charge at (212) 763-0060 or sadeh@halpersadeh.com or zhalper@halpersadeh.com. The investigation concerns whether Sila Realty and...
-
Echodyne被指定為Trust Automation價值4.9億美元美國空軍反無人機系統工程合約的雷達系統供應商
華盛頓州柯克蘭--(BUSINESS WIRE)--(美國商業資訊)-- 雷達平台公司Echodyne今日宣布,其產品被選為Trust Automation小型無人機防空系統(SUADS)反無人機系統平台的主力雷達系統,該系統將依據2025年8月公布的4.9億美元IDIQ合約交付給美國空軍。 可快速部署型小型無人機防空系統(RD-SUADS)、固定設點型小型無人機防空系統(FS-SUADS)和遠征型小型無人機防空系統(EX-SUADS)平台均遵循感測器開放系統架構(SOSA)標準,其中EchoShield雷達是該平台第一個完全整合的SOSA解決方案。RD-SUADS平台為獨立自供電反無人機系統,適配標準托盤尺寸,可透過軍用飛機便捷運輸;FS-SUADS則適用於永久性軍事設施部署,可群集或獨立整合,實現多樣化備援基地防護和360度安全防禦。EX-SUADS系統僅具備探測功能,專為託運行李運輸設計,尺寸可適配大型SUV車輛裝載。 EchoShield是市場首屈一指的中程雷達,能夠為所有類型和構型的無人機可靠、穩定地生成精準位置資料。身為一款商用現貨(COTS)雷達系統,EchoShield...
-
エコーダイン、Trust Automationの4億9,000万ドル規模の米空軍向け対UASエンジニアリング契約でレーダー・システムに採用
ワシントン州カークランド--(BUSINESS WIRE)--(ビジネスワイヤ) -- エコーダインは、2025年8月に発表された4億9,000万ドル規模のIDIQ契約に基づき米空軍に納入されるTrust Automationの小型無人航空機防衛システム(SUADS)の対UASプラットフォームにおいて、主要レーダー・システムとして採用されたことを発表しました。 Rapidly Deployable Small-Unmanned Air Defense System(RD-SUADS)、Fixed Site Small-Unmanned Air Defense System(FS-SUADS)、Expeditionary Small-Unmanned Air Defense System(EX-SUADS)の各プラットフォームは、Sensor Open Systems Architecture(SOSA)規格に準拠しており、EchoShieldレーダーは同プラットフォームにおける初の完全統合SOSAソリューションです。RD-SUADSプラットフォームは、標準パレット寸法に適合した自己完...
-
Echodyne被指定为Trust Automation价值4.9亿美元美国空军反无人机系统工程合同的雷达系统供应商
华盛顿州柯克兰--(BUSINESS WIRE)--(美国商业资讯)-- 雷达平台公司Echodyne今日宣布,其产品被选为Trust Automation小型无人机防空系统(SUADS)反无人机系统平台的主力雷达系统,该系统将依据2025年8月公布的4.9亿美元IDIQ合同交付给美国空军。 可快速部署型小型无人机防空系统(RD-SUADS)、固定站点型小型无人机防空系统(FS-SUADS)和远征型小型无人机防空系统(EX-SUADS)平台均遵循传感器开放系统架构(SOSA)标准,其中EchoShield雷达是该平台首个完全集成的SOSA解决方案。RD-SUADS平台为独立自供电反无人机系统,适配标准托盘尺寸,可通过军用飞机便捷运输;FS-SUADS则适用于永久性军事设施部署,可集群或独立集成,实现多样化冗余基地防护和360度安全防御。EX-SUADS系统仅具备探测功能,专为托运行李运输设计,尺寸可适配大型SUV车辆装载。 EchoShield是市场领先的中程雷达,能够为所有类型和构型的无人机可靠、稳定地生成精准位置数据。作为一款商用现货(COTS)雷达系统,EchoShield的行业...
-
New Poll: 2 in 3 Voters Prefer Congressional Candidates Who Support Vaccine Access – Partnership to Fight Infectious Disease
WASHINGTON--(BUSINESS WIRE)--American voters overwhelmingly trust independent doctors and scientists on vaccines, prefer candidates who support vaccine access, and want immunization recommendations free of political interference, according to a new national poll. The survey – conducted April 1-3, 2026, by Echelon Insights among 1,012 voters in the likely electorate – comes at a time when changes in vaccine policy and federal guidance are commanding increased national attention. The findings sug...
-
Echodyne nominata come sistema radar per il contratto da 490 milioni di dollari di Trust Automation per la progettazione di sistemi anti-UAS per l'Aeronautica Militare
KIRKLAND, Wash.--(BUSINESS WIRE)--Echodyne, l'azienda specializzata nella produzione di piattaforme radar, annuncia oggi la sua inclusione come sistema radar primario nella piattaforma Counter-UAS dello Small-Unmanned Air Defense System (SUADS, sistemi di difesa aerea con piccoli velivoli senza pilota) di Trust Automation, che sarà fornita all'Aeronautica Militare statunitense nell'ambito di un contratto IDIQ da 490 milioni di dollari annunciato nell'agosto 2025. Le piattaforme RD-SUADS (Sistem...
-
Echodyne geselecteerd als radarsysteem voor het Air Force Counter-UAS engineeringcontract van $490M van Trust Automation
KIRKLAND, Wash.--(BUSINESS WIRE)--Echodyne, een bedrijf dat radarplatforms produceert, maakte vandaag bekend dat het bedrijf opgenomen is als primair radarsysteem in het SUADS (Small-Unmanned Air Defense System) Counter-UAS platform van Trust Automation, dat aan de luchtmacht van de V.S. moet worden geleverd onder een IDIQ-contract van $490 miljoen, aangekondigd in augustus 2025. RD-SUADS (Rapidly Deployable Small-Unmanned Air Defense System), FS-SUADS (Fixed Site Small-Unmanned Air Defense Sys...