Newsroom
Sorted by: Latest
-
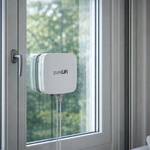
pureLiFi Debuts 10 Gbps "Connectivity DNA" and Bridges the 5G Gap With Global FWA Partners at MWC
BARCELONA, Spain--(BUSINESS WIRE)--Bridge XC Flex delivers Gigabit LiFi through windows. Partners Askey and Inseego get behind the LiFi bridging revolution for broadband deployment....
-
Rockfish Data Announces Integration with Snowflake to Accelerate Autonomous Network Operations with Privacy-Safe Synthetic Data
SAN RAMON, Calif.--(BUSINESS WIRE)--Rockfish Data today announced an integration with Snowflake, the AI Data Cloud company, designed to help telecom operators and network technology providers accelerate the development and validation of Autonomous network operations. The solution combines Snowflake’s AI Data Cloud with Rockfish’s synthetic data generation platform to produce realistic, privacy-safe network telemetry and observability data directly within Snowflake. Organizations can test analyt...

-
LoRa Alliance Outlines How LoRaWAN and Physical AI Are Teaming up to Maximize the Value of Both Technologies in the Global IoT Market
BARCELONA, Spain--(BUSINESS WIRE)--AI is reshaping the core tenets of IoT from connectivity and visibility to intelligence and action. At Mobile World Congress Barcelona 2026, the LoRa Alliance is announcing its vision for how LoRaWAN and AI are uniting to enable transformative capabilities and greater value throughout the IoT stack’s edge, core, and application layers. LoRaWAN has established itself as the LPWAN connectivity technology with the highest accessibility, within reach of anyone who...
-
Render Networks Unveils ClearWay, a Synchronized Agentic Architecture for Critical Infrastructure Execution
DENVER--(BUSINESS WIRE)--Render Networks Unveils ClearWay, a Synchronized Agentic Architecture for Critical Infrastructure Execution...
-
Medimaps Group et Radiobotics annoncent une fusion stratégique pour élargir leur portefeuille de produits d’analyse d’imagerie musculosquelettique assisté par IA
GENÈVE et COPENHAGUE--(BUSINESS WIRE)--Medimaps Group S.A., entreprise leader dans le domaine des solutions d’imagerie de la microarchitecture osseuse assistée par IA, et Radiobotics ApS, entreprise active dans les solutions de radiologie musculosquelettique assistée par IA, annoncent aujourd’hui avoir conclu un accord de fusion stratégique. La finalisation de la transaction est soumise à l’obtention de l’autorisation danoise en matière d’investissements directs étrangers (Foreign Direct Invest...

-
Medimaps Group and Radiobotics Announce Strategic Merger to Expand AI-Driven Musculoskeletal Imaging Portfolio
GENEVA & COPENHAGEN, Denmark--(BUSINESS WIRE)--Medimaps Group S.A., a global leader in AI-driven bone microarchitecture imaging solutions, and Radiobotics ApS, a leader in AI-powered MSK radiology solutions, today announced that they have entered into a strategic merger agreement. Closing of the transaction is subject to receipt of Danish foreign direct investment (FDI) approval and other customary closing conditions. The merger will combine the two specialized AI medical imaging analysis compa...

-
Arrcus and UfiSpace Collaborate on AI-Optimized Networking Platforms with Enhanced Scale and Security from the Edge to Core
BARCELONA, Spain--(BUSINESS WIRE)--Arrcus, the leader in distributed networking infrastructure, today announced a collaboration with UfiSpace focused on delivering carrier-grade, AI-optimized networking platforms designed to power large-scale service provider, data center, edge, and cloud environments. As distributed AI workloads expand beyond centralized data centers into service provider cores, metro networks, and distributed edge environments, operators are prioritizing platforms that combin...

-
HARMAN and Viasat Collaborate to Enable In-Cabin Voice Calls Over Satellite Communications
BARCELONA, Spain--(BUSINESS WIRE)--MWC Barcelona 2026 – HARMAN, the automotive technology leader and subsidiary of Samsung Electronics Co., Ltd., announces a new collaboration with Viasat Inc. (NASDAQ: VSAT), a global leader in satellite communications, to introduce in-cabin voice calling over satellite connectivity. At MWC Barcelona 2026 (Hall 2, Stand #2D51), HARMAN is demonstrating satellite-enabled voice calling capabilities on its Ready Connect Telematics Control Unit (TCU), highlighting h...
-
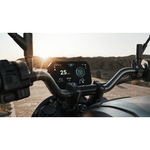
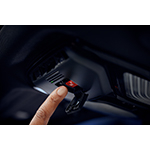
Ready Ride: HARMAN vernetzt das Motorrad – robust, updatefähig und bereit für die nächste Mobilitätsära
BARCELONA--(BUSINESS WIRE)--MWC Barcelona 2026 – Auf dem MWC Barcelona 2026 stellt HARMAN, führender Anbieter von Automotive-Technologien und Tochtergesellschaft der Samsung Electronics Co., Ltd., mit Ready Ride eine zukunftssichere, robuste End-to-End-Konnektivitätsplattform für Zweiräder vor. Die Lösung verkürzt Entwicklungs- und Markteinführungszeiten für OEMs und senkt zugleich die Gesamtbetriebskosten für Fahrerinnen und Fahrer. Mit Ready Ride bringt HARMAN erstmals eine speziell auf die A...

-
HARMAN、二輪車向けコネクティビティプラットフォーム「Ready Ride」を正式発表
バルセロナ--(BUSINESS WIRE)--(ビジネスワイヤ) -- MWC バルセロナ 2026 – Samsung Electronics Co., Ltd. の子会社であり、自動車向けテクノロジーのリーディングカンパニーであるHARMAN International は MWC Barcelona 2026(Hall 2、Stand #2D51)にて、二輪車市場向けに特化して開発された新しいコネクティビティプラットフォーム「Ready Ride」を発表しました。本プラットフォームは、OEM の市場投入期間短縮、開発・運用コスト削減、そしてライダー体験の高度化を実現するエンドツーエンド(End‑to‑End)のコネクティビティプラットフォームです。 Berg Insight によれば、世界の二輪車のコネクテッド化率は 5% 未満に留まっています。ナビゲーションや安全・セキュリティ、車両のアップグレード性への需要が高まるなか、モバイル端末の車載利用には振動や耐候性の課題があり、二輪車に最適化された常時接続のプラットフォームが求められています。HARMAN は、120か国で2,0...