Newsroom
Sorted by: Latest
-
Infobip Recognized as RCS for Business Leader by Juniper Research
VODNJAN, Croatia--(BUSINESS WIRE)--Infobip has been named the number one Established Leader in the Juniper Research RCS for Business 2026 Leaderboard....
-
Merck Announces Positive New Data for ENFLONSIA™ (clesrovimab) for Infants and Children Under 2 Years of Age at Increased Risk for Severe Respiratory Syncytial Virus (RSV) Disease Over Two RSV Seasons
RAHWAY, N.J.--(BUSINESS WIRE)--Merck Announces Positive New Data for ENFLONSIA™ (clesrovimab) for Infants and Children Under 2 at Increased Risk for Severe RSV Over Two RSV Seasons...
-
Sunnybrook Receives $10M Gift to Expand OCD Research, Education, and Treatment
TORONTO--(BUSINESS WIRE)--Sunnybrook is expanding access to treatment and investing in the future of care for people living with severe OCD and related disorders....
-
SEQSTER Launches 1-Click Data Refinery™ to Power Scalable AI Across Clinical Trials
SAN DIEGO--(BUSINESS WIRE)--SEQSTER PDM, Inc. (“SEQSTER”), the leading healthcare technology company and the data connection, collection, and orchestration layer for patient health data, today announced the launch of 1-Click Data Refinery™, an enterprise-grade data harmonization engine designed for pharmaceutical companies, contract research organizations, and healthcare enterprises. The solution transforms raw, patient-consented EHR data into clean, structured, AI-ready patient records that su...

-
Serviceplan Group Deploys Creative AI Across Global Operations in Partnership With Luma AI
PALO ALTO, Calif. & MUNICH--(BUSINESS WIRE)--Serviceplan Group today announced a strategic partnership with Luma AI to deploy AI for creative work across the agency group’s global operations....

-
FNIH Biomarkers Consortium Study Shows “Clock Model” Blood Test Can Predict Onset of Alzheimer’s Symptoms Years in Advance
NORTH BETHESDA, Md.--(BUSINESS WIRE)--New research from an FNIH Biomarkers Consortium study shows a blood test can predict the onset of Alzheimer's symptoms within 3 to 4 years....
-
GekkoVet and Royal Canin Enter Latin America with Mexico Launch, Opening a New Continent in their Global Partnership
HELSINKI & MEXICO CITY--(BUSINESS WIRE)--GekkoVet, the Finnish leader in AI-powered clinical decision support for veterinarians, and Royal Canin, a global pioneer in pet health through nutrition, announce the launch of their strategic collaboration in Mexico. This marks the first national rollout of their partnership in Latin America, expanding the initiative that began earlier this year with successful deployments in Asia. Royal Canin Mexico is equipping veterinary teams with GekkoVet’s intell...
-
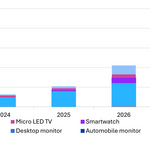
Omdia: Micro LED Display Revenue to Double to $105 Million in 2026 Driven by Near-Eye Smart Watch and Public Display Applications
LONDON--(BUSINESS WIRE)--Micro LED display revenue is projected to grow 100% year-over-year (YoY), increasing from $52.4 million in 2025 to $105.4 million in 2026, according to the Omdia Micro LED Display Market Tracker. While Micro LED displays for public display, ultra-large TVs, smart watches, and smart glasses remain limited, rapidly maturing manufacturing capabilities and new product adoption are expected to drive significant shipment and revenue growth in the near term. Until recently, la...
-
Star Mountain Capital Announces Final Close of Its Oversubscribed 2nd SBIC Fund at a Program Optimized Level of $286 Million
NEW YORK--(BUSINESS WIRE)--Star Mountain Capital, LLC (Star Mountain), a rapidly growing, employee-owned U.S. lower middle-market investment firm with approximately $4.5 billion in assets under management (AUM), is pleased to announce that it closed its second SBIC fund above its target at $286 million of investible capital, which is a fund size that optimizes the maximum amount of SBA debentures accessible for investors. As part of the Small Business Investment Company (SBIC) program, SBIC Fun...
-
Vonage Expands Developer Ecosystem to Accelerate the Next Era of Enterprise Digital Transformation
HOLMDEL, N.J.--(BUSINESS WIRE)--Vonage, part of Ericsson (NASDAQ: ERIC), today announced a number of new initiatives, to further expand and enable its global developer community. By growing its developer community and tools, giving developers and enterprises access to new mobile network insights and capabilities that can be embedded into existing applications and workflows, Vonage is accelerating its strategy to transform mobile networks into a programmable platform. Putting Vonage APIs in the...