


CHICAGO--(BUSINESS WIRE)--SullivanCotter, the nation’s leading independent consulting firm in the assessment and development of total rewards programs, workforce solutions, and data products for health care and not-for-profits, has released new data and benchmarks from its 2024 Physician Compensation and Productivity Survey Report.
Although median total cash compensation (TCC) continues to increase year-over-year across all major specialty categories, it has returned to historical average growth of 3.5% following significant increases in 2023. This year, the Adult Medical and Pediatric Surgical specialty categories saw the greatest increases at 4.5% and 4.4% respectively. However, over the last five years encompassing the COVID-19 pandemic and significant changes to the Medicare Physician Fee Schedule (MPFS) in 2021 and 2023, primary care physicians have seen significantly larger compensation increases than other specialty categories at 16.5% since 2020. This increase aligns with the intent of the 2021 MPFS changes which significantly increased Medicare reimbursement for office-based Evaluation and Management (E&M) CPT codes.
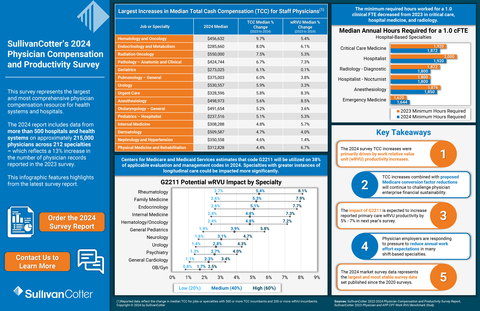
SullivanCotter’s data represents the largest and most comprehensive physician compensation resource for health systems and hospitals. This year’s report includes data from more than 500 hospitals and health systems on approximately 215,000 physicians across 212 specialties. This reflects a 13% increase in the number of physician records reported in the 2023 survey.
Several market forces continue to influence physician compensation in 2024. Perhaps the most significant and long-lasting trend is changing physician workforce expectations. “The pandemic exacerbated workforce expectations for a more sustainable work life. We see this manifested as reduced or eliminated call expectations, additional paid time off, fewer annual expected work hours, and more interest in compensation plans with a higher proportion of fixed compensation and a lower proportion of compensation at risk,” said Dave Hesselink, Managing Principal, SullivanCotter. The 2024 survey documented decreases in annual expected work hours in Critical Care, Hospital Medicine, and Radiology.
This year’s survey report shows increases in TCC were primarily driven by productivity increases. From 2023 to 2024, reported median work relative value unit (wRVU) productivity for the Adult Medical, Primary Care, and Pediatric Medical specialty categories saw increases of 4-6%. “This is likely due to ongoing recovery from the pandemic in 2023 as well as reported wRVU increases from the remaining organizations adopting the 2021 MPFS changes,” said Hesselink.
Increases to the wRVU values associated with hospital-based E&M CPT codes drove reported median wRVU increases in hospital-based specialties such as Hospitalist – Family Medicine (9.1%), Emergency Medicine (8.6%), and Hospitalist – Internal Medicine (8.3%).
Additionally, the 2024 report shows that base salary and wRVU productivity continue to be prevalent compensation plan components in Primary Care, Medical, and Surgical specialty compensation plans. Prevalence for these components ranges from 65-75%, which is consistent with last year’s results. Value-based or quality incentives are used by approximately 50% of organizations with payments averaging 6.8% of TCC for specialists, and 8.6% of TCC for Primary Care.
Although many of the high-level compensation design practices are relatively consistent year-over-year, there is greater variation in the number and type of plans being used. “When it comes to compensation design, the days of a ‘one-size-fits-all’ approach for groups of any size or specialty mix are gone. As the market looks to align compensation more closely with how care is delivered, we’re seeing varying approaches for physicians based on the care delivery model. You’ll see significant differences, for instance, in the mix of compensation components and corresponding proportion of overall pay for a coverage-based specialist as opposed to a primary care physician, and even differentiation within primary care based on the patient population being served,” said Mark Ryberg, Physician Workforce Practice Leader, SullivanCotter.
About SullivanCotter
SullivanCotter partners with health care and other not-for-profit organizations to understand what drives performance and improves outcomes through the development and implementation of integrated workforce strategies. Using our time-tested methodologies and industry-leading research and information, we provide data-driven insights, expertise, and data products to help organizations align business strategy and performance objectives – enabling our clients to deliver on their mission, vision, and values.
For more information on SullivanCotter’s surveys, please visit our website at www.sullivancotter.com, or contact us via email or by phone at 888.739.7039.
Note to media: Additional data and interviews are available on request.
