CoreLogic: US Homeowners See Equity Increase to Nearly All-Time High in Q1
CoreLogic: US Homeowners See Equity Increase to Nearly All-Time High in Q1
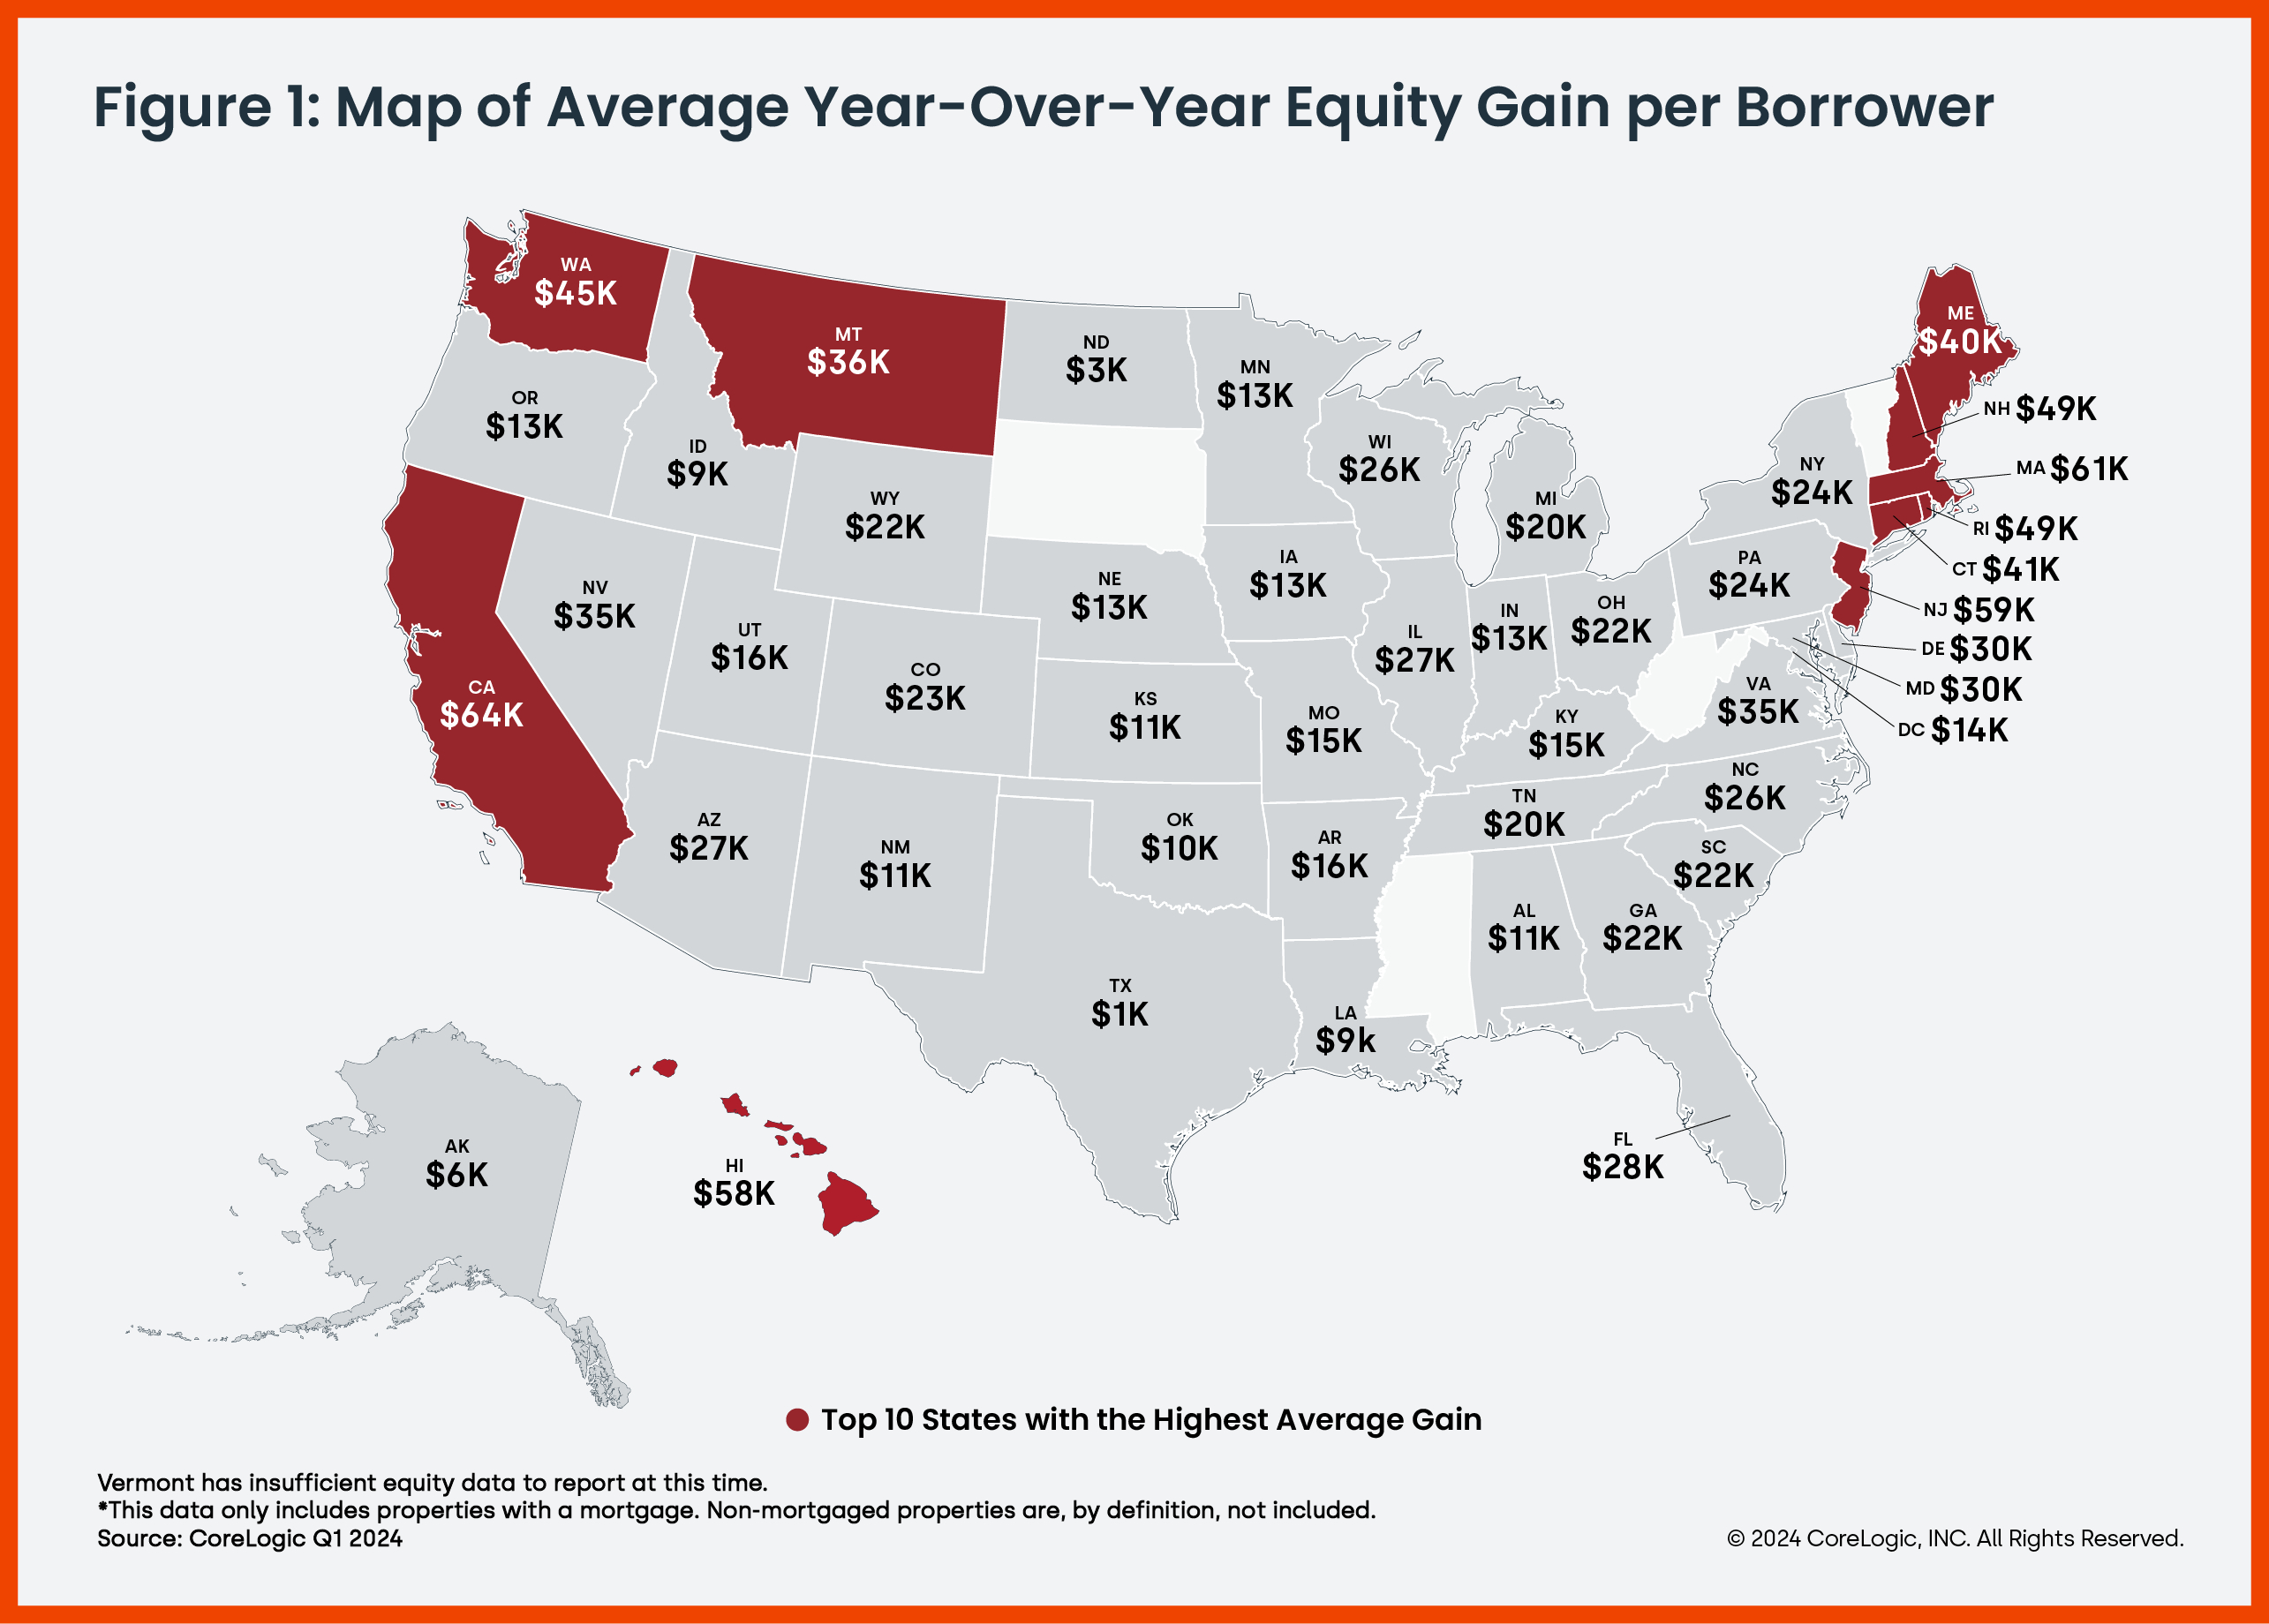
- U.S. homeowners with a mortgage pulled in $28,000 in equity gains year over year in first quarter of 2024, the highest number since late 2022.
- California ($64,000), Massachusetts ($61,000) and New Jersey ($59,000) led the country for annual home equity gains in the first quarter.
- Los Angeles topped major metro areas for year-over-year home equity growth at $72,000.
IRVINE, Calif.--(BUSINESS WIRE)--CoreLogic®, a leading global property information, analytics and data-enabled solutions provider, today released the Homeowner Equity Report (HER) for the first quarter of 2024. The report shows that U.S. homeowners with mortgages (which account for roughly 62% of all properties) saw home equity increase by 9.6% year over year, representing a collective gain of $1.5 trillion and an average increase of $28,000 per borrower since the first quarter of 2023. This brought total net homeowner equity to more than $17 trillion at the end of Q1 2024.
U.S. homeowners with a mortgage continued to see healthy annual equity gains in the opening quarter of 2024. As one of the nation’s most expensive states with perpetually high housing demand, California homeowners saw the largest equity gain in the country at $64,000, with those in the Los Angeles metro area netting $72,000 year over year. Most of the other large equity gains were concentrated in the Northeast, including New Jersey ($59,000), a state that has ranked in the top three for annual appreciation in CoreLogic’s monthly Home Price Insights report since last fall.
“With home prices continuing to reach new highs, owners are also seeing their equity approach the historic peaks of 2023, close to a total of $305,000 per owner,” said Dr. Selma Hepp, chief economist for CoreLogic. “Importantly, higher prices have also lifted some 190,000 homeowners out of negative equity, leaving only about 1.8% of those with mortgages underwater.”
“Home equity is key to mortgage holders who have seen other homeownership costs soar, including insurance, taxes and HOA fees, as a source of financial buffer,” Hepp continued. “Also, low amounts of negative equity are welcomed in markets that have shown price weaknesses this spring, such as Florida (1.1% of homes underwater) and Texas (1.7% of homes underwater) — both of which are below the national rate — as further price declines could drive more homeowners to lose their equity.”
Negative equity, also referred to as underwater or upside-down mortgages, applies to borrowers who owe more on their mortgages than their homes are currently worth. As of the first quarter of 2024, the quarterly and annual changes in negative equity were:
- Quarterly change: From the fourth quarter of 2023 to the first quarter of 2024, the total number of mortgaged homes in negative equity decreased by 2.1%, to 1 million homes or 1.8% of all mortgaged properties.
- Annual change: From the first quarter of 2023 to the first quarter of 2024, the total number of homes in negative equity decreased by 16.1%, to 1.2 million homes or 2.1% of all mortgaged properties.
Because home equity is affected by home price changes, borrowers with equity positions near (+/- 5%), the negative equity cutoff, are most likely to move out of or into negative equity as prices change, respectively. Looking at the first quarter of 2024 book of mortgages, if home prices increase by 5%, 111,000 homes would regain equity; if home prices decline by 5%, 153,000 properties would fall underwater.
The next CoreLogic Homeowner Equity Report will be released in September 2024, featuring data for Q2 2024. For ongoing housing trends and data, visit the CoreLogic Intelligence Blog: www.corelogic.com/intelligence.
Methodology
The amount of equity for each property is determined by comparing the estimated current value of the property against the mortgage debt outstanding (MDO). If the MDO is greater than the estimated value, then the property is determined to be in a negative equity position. If the estimated value is greater than the MDO, then the property is determined to be in a positive equity position. The data is first generated at the property level and aggregated to higher levels of geography. CoreLogic uses public record data as the source of the MDO, which includes more than 50 million first- and second mortgage liens and is adjusted for amortization and home equity utilization in order to capture the true level of MDO for each property. Only data for mortgaged residential properties that have a current estimated value are included. There are several states or jurisdictions where the public record, current value or mortgage data coverage is thin and have been excluded from the analysis. These instances account for fewer than 5% of the total U.S. population. The percentage of homeowners with a mortgage is from the 2019 American Community Survey. Data for the previous quarter was revised. Revisions with public records data are standard, and to ensure accuracy, CoreLogic incorporates the newly released public data to provide updated results.
Source: CoreLogic
The data provided is for use only by the primary recipient or the primary recipient's publication or broadcast. This data may not be re-sold, republished or licensed to any other source, including publications and sources owned by the primary recipient's parent company without prior written permission from CoreLogic. Any CoreLogic data used for publication or broadcast, in whole or in part, must be sourced as coming from CoreLogic, a data and analytics company. For use with broadcast or web content, the citation must directly accompany first reference of the data. If the data is illustrated with maps, charts, graphs or other visual elements, the CoreLogic logo must be included on screen or website. For questions, analysis or interpretation of the data, contact Robin Wachner at newsmedia@corelogic.com. For sales inquiries, please visit https://www.corelogic.com/support/sales-contact/. Data provided may not be modified without the prior written permission of CoreLogic. Do not use the data in any unlawful manner. This data is compiled from public records, contributory databases and proprietary analytics, and its accuracy is dependent upon these sources.
About CoreLogic
CoreLogic is a leading provider of property insights and innovative solutions, working to transform the property industry by putting people first. Using its network, scale, connectivity and technology, CoreLogic delivers faster, smarter, more human-centered experiences that build better relationships, strengthen businesses and ultimately create a more resilient society. For more information, please visit www.corelogic.com.
CORELOGIC and the CoreLogic logo are trademarks of CoreLogic, Inc. and/or its subsidiaries. All other trademarks are the property of their respective owners.
Contacts
Media Contact:
Robin Wachner
newsmedia@corelogic.com
Sales Contact:
https://www.corelogic.com/support/sales-contact/