LOS ANGELES--(BUSINESS WIRE)--Otter:
Celebrating Pi Day With Facts on America’s Favorite Pie
On Pi Day and every other day, one thing’s for sure – Americans love pizza. At any given second, Americans are devouring 350 slices of pizza, 93% of Americans order pizza at least once a month and 36% of Americans believe that pizza qualifies as a breakfast item. The first pizza pie was delivered in 1889, and pizza’s popularity has continued to climb ever since.
In celebration of Pi Day, the team at Otter dug into the 1 billion+ orders they’ve processed to discover pizzeria and pizza chain trends. Read on to learn about shifts and growth in the pizza industry and uncover 3 ways to increase your pizzeria or pizza chain’s cash flow.
Pizza Facts and Stats You Need to Know
Industry Growth
The pizzeria location count increased by 4.97% from 2022 to 2023, and in 2023, pizzerias made up 5.84% of the total restaurants in the US. Not only are there many pizzerias, but most of those pizzerias are highly rated – with an average rating of 4.43 stars.
Most Popular Toppings
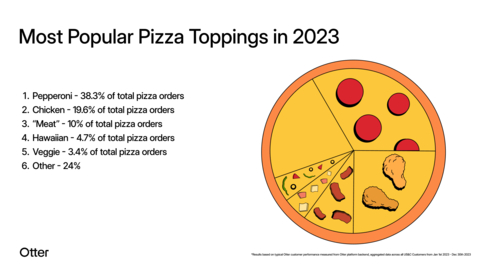
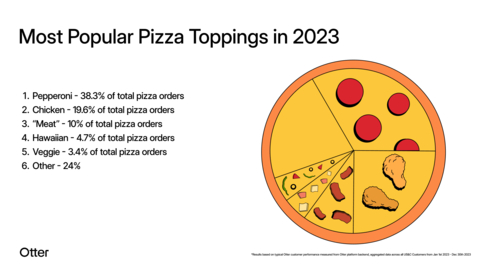
One of the classics, pepperoni, continues to be a fan favorite making up 38.3% of total pizza orders. Other beloved toppings include:
- Pepperoni - 38.3% of total pizza orders
- Chicken - 19.6% of total pizza orders
- “Meat” - 10% of total pizza orders
- Hawaiian - 4.7% of total pizza orders
- Veggie - 3.4% of total pizza orders
Pizza Facts by State
While many believe New York has the best pizza, it doesn't have the most pizzerias. The states with the highest density of pizzerias relative to general restaurants are:
- New Hampshire - 9.04% of all restaurants
- West Virginia - 8.94% of all restaurants
- Iowa - 8.29% of all restaurants
- Nebraska - 7.62% of all restaurants
- Maine - 7.58% of all restaurants
The states with the least pizzeria coverage are:
- Hawaii - 1.51%
- California - 1.67%
- Texas - 2.30%
- Florida -2.30%
- Georgia - 2.33%
As with any other cuisine type, the quality of a pizzeria can be measured by order ratings. The states with the top rated pizzerias are:
- New Hampshire
- Maine
- Wisconsin
- Kentucky
- Oklahoma
The states with the lowest rated pizzeria are:
- Wyoming
- South Carolina
- Montana
- Kansas
- Pennsylvania
The amount spent per order also varies by state. When compared to the mean average order value for pizzerias (AOV) of $31.10, the states with the highest AOV are:
- Hawaii - $48.5
- California - $40.1
- Montana - $38.9
- Wyoming - $38.3
- Nevada - $37.6
- Illinois - $37.4
The states with the lowest AOV are:
- Mississippi - $21.6
- Utah - $21.8
- Alabama - $23.4
- Louisiana - $25.3
- Indiana - $25.6
- New Mexico - $26.4
3 ways to Increase your Pizzeria or Pizza Chain’s Cash Flow
-
Pay attention to internal issues and delivery orders – especially during peak hours. 51% of pizzeria and pizza chain orders come through from 4:00 pm to 8:59 pm, but 51.5% of pizza order cancellations happen between the same window. In an industry with razor thin margins, keeping cancellations down can have a huge impact on your bottom line. The top reason for cancelled pizza orders is “internal issues/kitchen closed.” If your busy pizzeria or pizza chain faces challenges like incorrect online hours or out of stock inventory resulting in the “internal issues” cancellation reason, consider utilizing a Menu Management tool like Otter’s to update your hours and menu across all online platforms from one place.
-
Use delivery promotions to boost your AOV. Utilizing delivery promotions like buy-one-get-one or x% off of y is not only a great way to set yourself apart from the competition online, it can also be a means of driving up your average order value. For pizzerias and pizza chains in particular, the AOV of an order with a promotion is +25.6% greater than the average AOV.
- Make sure you’ve got the fan-favorite menu items covered. Since 38.3% of total orders are for pepperoni pizza, it’s critical to make sure this item is present at the top of your menu. It’s also key to constantly keep the inventory in stock to deliver plenty of pepperoni pizzas – since this topping in particular happens to represent 42.4% of total order cancellations. In addition to pepperoni, make sure you have options for chicken pizza on your menu, whether BBQ, Buffalo, or your own special recipe. 19.6% of total pizza orders are for pizza with chicken. Unsurprisingly, when it comes to one of America’s favorite cuisines, the bigger the better – large pizzas were preferred over medium and small sizes, so make sure this is reflected accordingly on your menu.
Looking for more ways to boost your pizzeria or pizza chain's efficiency and orders? Try Otter!
The average pizzeria sees a 17.2% reduction in cancelled orders after a year of using Otter. We’d love to help supercharge your pizza business. Get in touch with us HERE.
*Results based on typical Otter customer performance measured from Otter platform backend, aggregated data across all US&C Customers from Jan 1st 2023 - Dec 30th 2023


