WESTLAKE, Texas--(BUSINESS WIRE)--The Charles Schwab Corporation released its Monthly Activity Report today. Company highlights for the month of July 2023 include:
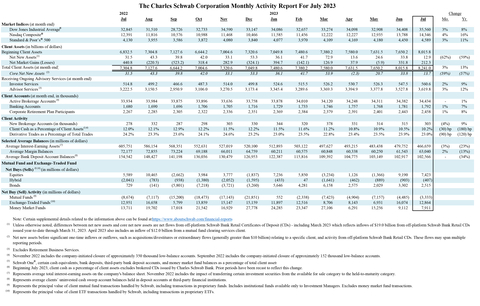
- Core net new assets brought to the company by new and existing clients totaled $13.7 billion. Net new assets excluding mutual fund clearing totaled $11.9 billion.
- Total client assets were $8.24 trillion as of month-end July, up 13% from July 2022 and up 3% compared to June 2023.
- Average margin balances were $63.0 billion in July, down 13% from July 2022 and up 2% compared to June 2023.
Commentary from the CFO
Chief Financial Officer Peter Crawford commented, “As we continue to progress through the Ameritrade client conversion, we are observing initial evidence of the deal-related attrition we allowed for within the transaction math outlined at the announcement back in November 2019. These temporarily lower net flows reflect our organic asset gathering being offset by expected attrition within certain client cohorts, including recently converted Ameritrade retail clients as well as a modest number of Ameritrade advisor clients ahead of their planned transition to the Schwab platform in September. Additionally, we have elected to proactively resign from certain atypical custodial relationships previously served by Ameritrade’s institutional business that are inconsistent with our approach to serving Registered Investment Advisors. We anticipate these temporary conversion-related dynamics will subside following the completion of the final transition group during the first half of 2024. Based on our experience with the first two conversion groups, as well as our latest projections, we believe that the ultimate attrition will be in-line with or slightly better than our initial estimates – approximately 4% of Ameritrade revenue prior to the deal or around 1% of combined total client assets as of December 31, 2022. With all of this in mind, Schwab’s competitive position remains strong as July new brokerage accounts increased 9% from the prior year to 303 thousand - marking the 9th consecutive month of new accounts exceeding 300 thousand.
In addition to our overall July results demonstrating healthy client engagement and momentum, the average daily pace of client cash realignment outflows during the month remained generally consistent with prior periods, even as strong net equity purchasing persisted throughout the month. The continuation of this trend further underscores our confidence that we will see a resumption of deposit growth later this year.”
Forward-Looking Statements
This press release contains forward-looking statements relating to the Ameritrade client conversion; client attrition, including timing and estimates; net flows; competitive position; client engagement and momentum; client cash realignment pace and trends; and deposit growth. These forward-looking statements reflect management’s expectations as of the date hereof. Achievement of these expectations and objectives is subject to risks and uncertainties that could cause actual results to differ materially from the expressed expectations.
Important factors that may cause such differences include, but are not limited to, the risk that Ameritrade client transitions are not completed when expected or do not result in a positive client experience; client attrition and the impact is higher than expected; client use of the company’s advisory solutions and other products and services; general market conditions, including the level of interest rates and equity valuations; client cash allocation decisions; client sensitivity to rates; level of client assets, including cash balances; competitive pressures on pricing; capital and liquidity needs and management; balance sheet positioning relative to changes in interest rates; interest earning asset mix and growth; the level and mix of client trading activity; market volatility; securities lending; margin loan balances; and new or changed legislation, regulation or regulatory expectations. Other important factors include the company’s ability to successfully implement integration strategies and plans; attract and retain clients and independent investment advisors and grow those relationships and client assets; develop and launch new and enhanced products, services, and capabilities, as well as enhance its infrastructure and capacity, in a timely and successful manner; hire and retain talent; support client activity levels; monetize client assets; and other factors set forth in the company’s most recent reports on Form 10-K and Form 10-Q.
About Charles Schwab
The Charles Schwab Corporation (NYSE: SCHW) is a leading provider of financial services, with 34.4 million active brokerage accounts, 2.5 million corporate retirement plan participants, 1.8 million banking accounts, and $8.24 trillion in client assets as of July 31, 2023. Through its operating subsidiaries, the company provides a full range of wealth management, securities brokerage, banking, asset management, custody, and financial advisory services to individual investors and independent investment advisors. Its broker-dealer subsidiaries, Charles Schwab & Co., Inc., TD Ameritrade, Inc., and TD Ameritrade Clearing, Inc., (members SIPC, https://www.sipc.org), and their affiliates offer a complete range of investment services and products including an extensive selection of mutual funds; financial planning and investment advice; retirement plan and equity compensation plan services; referrals to independent, fee-based investment advisors; and custodial, operational and trading support for independent, fee-based investment advisors through Schwab Advisor Services. Its primary banking subsidiary, Charles Schwab Bank, SSB (member FDIC and an Equal Housing Lender), provides banking and lending services and products. More information is available at https://www.aboutschwab.com.
TD Ameritrade, Inc. and TD Ameritrade Clearing, Inc. are separate but affiliated companies and subsidiaries of TD Ameritrade Holding Corporation. TD Ameritrade Holding Corporation is a wholly owned subsidiary of The Charles Schwab Corporation. TD Ameritrade is a trademark jointly owned by TD Ameritrade IP Company, Inc. and The Toronto-Dominion Bank.
| The Charles Schwab Corporation Monthly Activity Report For July 2023 | ||||||||||||||||||||||||||||||
2022 |
2023 |
Change | ||||||||||||||||||||||||||||
| Jul | Aug | Sep | Oct | Nov | Dec | Jan | Feb | Mar | Apr | May | Jun | Jul | Mo. | Yr. | ||||||||||||||||
| Market Indices (at month end) | ||||||||||||||||||||||||||||||
| Dow Jones Industrial Average® | 32,845 |
31,510 |
28,726 |
32,733 |
34,590 |
33,147 |
34,086 |
32,657 |
33,274 |
34,098 |
32,908 |
34,408 |
35,560 |
3% |
8% |
|||||||||||||||
| Nasdaq Composite® | 12,391 |
11,816 |
10,576 |
10,988 |
11,468 |
10,466 |
11,585 |
11,456 |
12,222 |
12,227 |
12,935 |
13,788 |
14,346 |
4% |
16% |
|||||||||||||||
| Standard & Poor’s® 500 | 4,130 |
3,955 |
3,586 |
3,872 |
4,080 |
3,840 |
4,077 |
3,970 |
4,109 |
4,169 |
4,180 |
4,450 |
4,589 |
3% |
11% |
|||||||||||||||
| Client Assets (in billions of dollars) | ||||||||||||||||||||||||||||||
| Beginning Client Assets | 6,832.5 |
7,304.8 |
7,127.6 |
6,644.2 |
7,004.6 |
7,320.6 |
7,049.8 |
7,480.6 |
7,380.2 |
7,580.0 |
7,631.5 |
7,650.2 |
8,015.8 |
|||||||||||||||||
| Net New Assets (1) | 31.5 |
43.3 |
39.8 |
42.0 |
33.1 |
53.3 |
36.1 |
41.7 |
72.9 |
13.6 |
24.6 |
33.8 |
12.9 |
(62%) |
(59%) |
|||||||||||||||
| Net Market Gains (Losses) | 440.8 |
(220.5) |
(523.2) |
318.4 |
282.9 |
(324.1) |
394.7 |
(142.1) |
126.9 |
37.9 |
(5.9) |
331.8 |
212.3 |
|||||||||||||||||
| Total Client Assets (at month end) | 7,304.8 |
7,127.6 |
6,644.2 |
7,004.6 |
7,320.6 |
7,049.8 |
7,480.6 |
7,380.2 |
7,580.0 |
7,631.5 |
7,650.2 |
8,015.8 |
8,241.0 |
3% |
13% |
|||||||||||||||
| Core Net New Assets (2) | 31.5 |
43.3 |
39.8 |
42.0 |
33.1 |
53.3 |
36.1 |
41.7 |
53.9 |
(2.3) |
20.7 |
33.8 |
13.7 |
(59%) |
(57%) |
|||||||||||||||
| Receiving Ongoing Advisory Services (at month end) | ||||||||||||||||||||||||||||||
| Investor Services | 514.8 |
499.2 |
466.6 |
487.3 |
514.0 |
499.8 |
524.6 |
515.5 |
526.2 |
530.7 |
526.3 |
547.5 |
560.6 |
2% |
9% |
|||||||||||||||
| Advisor Services (3) | 3,222.5 |
3,150.5 |
2,950.9 |
3,106.0 |
3,270.5 |
3,173.4 |
3,345.4 |
3,289.6 |
3,369.3 |
3,394.9 |
3,377.8 |
3,527.8 |
3,619.8 |
3% |
12% |
|||||||||||||||
| Client Accounts (at month end, in thousands) | ||||||||||||||||||||||||||||||
| Active Brokerage Accounts (4) | 33,934 |
33,984 |
33,875 |
33,896 |
33,636 |
33,758 |
33,878 |
34,010 |
34,120 |
34,248 |
34,311 |
34,382 |
34,434 |
- |
1% |
|||||||||||||||
| Banking Accounts | 1,680 |
1,690 |
1,696 |
1,706 |
1,705 |
1,716 |
1,729 |
1,733 |
1,746 |
1,757 |
1,768 |
1,781 |
1,792 |
1% |
7% |
|||||||||||||||
| Corporate Retirement Plan Participants | 2,267 |
2,285 |
2,305 |
2,322 |
2,336 |
2,351 |
2,369 |
2,384 |
2,379 |
2,391 |
2,401 |
2,443 |
2,458 |
1% |
8% |
|||||||||||||||
| Client Activity | ||||||||||||||||||||||||||||||
| New Brokerage Accounts (in thousands) | 278 |
332 |
287 |
298 |
303 |
330 |
344 |
320 |
378 |
331 |
314 |
315 |
303 |
(4%) |
9% |
|||||||||||||||
| Client Cash as a Percentage of Client Assets (5,6) | 12.0% |
12.1% |
12.9% |
12.2% |
11.5% |
12.2% |
11.5% |
11.6% |
11.2% |
10.8% |
10.9% |
10.5% |
10.2% |
(30) bp | (180) bp | |||||||||||||||
| Derivative Trades as a Percentage of Total Trades | 24.2% |
23.3% |
23.6% |
24.1% |
24.6% |
23.2% |
23.0% |
23.5% |
22.8% |
23.4% |
23.5% |
23.9% |
23.0% |
(90) bp | (120) bp | |||||||||||||||
| Selected Average Balances (in millions of dollars) | ||||||||||||||||||||||||||||||
| Average Interest-Earning Assets (7) | 605,751 |
586,154 |
568,351 |
552,631 |
527,019 |
520,100 |
512,893 |
503,122 |
497,627 |
493,215 |
483,438 |
479,752 |
466,659 |
(3%) |
(23%) |
|||||||||||||||
| Average Margin Balances | 72,177 |
72,855 |
73,224 |
69,188 |
66,011 |
64,759 |
60,211 |
60,575 |
60,848 |
60,338 |
60,250 |
61,543 |
63,040 |
2% |
(13%) |
|||||||||||||||
| Average Bank Deposit Account Balances (8) | 154,542 |
148,427 |
141,198 |
136,036 |
130,479 |
126,953 |
122,387 |
115,816 |
109,392 |
104,775 |
103,149 |
102,917 |
102,566 |
- |
(34%) |
|||||||||||||||
| Mutual Fund and Exchange-Traded Fund | ||||||||||||||||||||||||||||||
| Net Buys (Sells) (9,10) (in millions of dollars) | ||||||||||||||||||||||||||||||
| Equities | 5,589 |
10,465 |
(2,662) |
3,984 |
3,777 |
(1,837) |
7,236 |
5,850 |
(3,234) |
1,126 |
(1,366) |
9,190 |
7,423 |
|||||||||||||||||
| Hybrid | (2,041) |
(783) |
(938) |
(1,380) |
(2,052) |
(1,595) |
(433) |
47 |
(1,641) |
(462) |
(889) |
(903) |
(407) |
|||||||||||||||||
| Bonds | 729 |
(141) |
(5,801) |
(7,218) |
(3,721) |
(3,260) |
5,646 |
4,281 |
6,158 |
2,575 |
2,029 |
3,302 |
2,515 |
|||||||||||||||||
| Net Buy (Sell) Activity (in millions of dollars) | ||||||||||||||||||||||||||||||
| Mutual Funds (9) | (8,674) |
(7,117) |
(15,200) |
(18,473) |
(17,143) |
(21,851) |
552 |
(2,338) |
(7,423) |
(4,904) |
(7,157) |
(4,485) |
(3,333) |
|||||||||||||||||
| Exchange-Traded Funds (10) | 12,951 |
16,658 |
5,799 |
13,859 |
15,147 |
15,159 |
11,897 |
12,516 |
8,706 |
8,143 |
6,931 |
16,074 |
12,864 |
|||||||||||||||||
| Money Market Funds | 13,711 |
19,702 |
17,018 |
21,542 |
16,929 |
27,778 |
24,285 |
23,347 |
27,106 |
6,291 |
15,256 |
9,112 |
7,911 |
|||||||||||||||||
|
Note: Certain supplemental details related to the information above can be found at: https://www.aboutschwab.com/financial-reports. |
(1) |
Unless otherwise noted, differences between net new assets and core net new assets are net flows from off-platform Schwab Bank Retail Certificates of Deposit (CDs) - including March 2023 which reflects inflows of $19.0 billion from off-platform Schwab Bank Retail CDs issued year-to-date through March 31, 2023. April 2023 also includes an inflow of $12.0 billion from a mutual fund clearing services client. |
(2) |
Net new assets before significant one-time inflows or outflows, such as acquisitions/divestitures or extraordinary flows (generally greater than $10 billion) relating to a specific client, and activity from off-platform Schwab Bank Retail CDs. These flows may span multiple reporting periods. |
(3) |
Excludes Retirement Business Services. |
(4) |
November 2022 includes the company-initiated closure of approximately 350 thousand low-balance accounts. September 2022 includes the company-initiated closure of approximately 152 thousand low-balance accounts. |
(5) |
Schwab One®, certain cash equivalents, bank deposits, third-party bank deposit accounts, and money market fund balances as a percentage of total client assets. |
(6) |
Beginning July 2023, client cash as a percentage of client assets excludes brokered CDs issued by Charles Schwab Bank. Prior periods have been recast to reflect this change. |
(7) |
Represents average total interest-earning assets on the company's balance sheet. November 2022 includes the impact of transferring certain investment securities from the available for sale category to the held-to-maturity category. |
(8) |
Represents average clients’ uninvested cash sweep account balances held in deposit accounts at third-party financial institutions. |
(9) |
Represents the principal value of client mutual fund transactions handled by Schwab, including transactions in proprietary funds. Includes institutional funds available only to Investment Managers. Excludes money market fund transactions. |
(10) |
Represents the principal value of client ETF transactions handled by Schwab, including transactions in proprietary ETFs. |


