BOSTON--(BUSINESS WIRE)--Not surprisingly, ongoing market swings and concerns about inflation continue to cause financial stress among retirement savers. In fact, according to recent Fidelity Investments® research1, the percentage of individuals with negative feelings about their finances (32%) is now greater than those who have positive feelings (30%), which is a stark contrast to just a year ago, when the percentage of workers who felt positive about their finances (45%) was more than twice the percentage of those with negative feelings (22%).
Despite the negative sentiment, one area where people have yet to put the brakes on involves retirement savings. Fidelity Investments, one of the country’s leading workplace benefits providers2 and America’s No. 1 IRA provider3, today released its Q3 2022 analysis of savings behaviors and account balances for more than 35 million IRA, 401(k), and 403(b) retirement accounts, which reveals some persistent silver linings. Although average account balances have decreased, the data suggests retirement savers continue to focus on the long-term: total 401(k) savings rates held strong, the number of IRAs on Fidelity’s platform continued to increase, and the percentage of employees with 401(k) loans remained low for a sixth consecutive quarter.
“The market has taken some dramatic turns this year, including the best month this past October since 1976,” said Kevin Barry, president of Workplace Investing at Fidelity Investments. “Retirement savers have wisely chosen to avoid the drama and continue making smart choices for the long-term. This is important, because one of the most essential aspects of a sound retirement savings strategy is contributing enough consistently – in up markets, down markets, and sideways markets -- to help reach your goals.”
Top-line findings from Fidelity’s Q3 2022 analysis include:
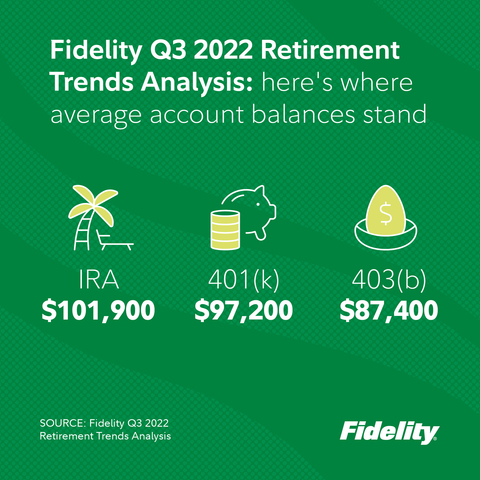
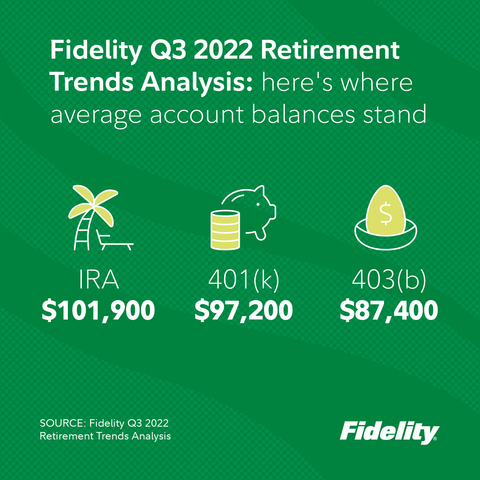
- Average retirement account balances decreased for the third consecutive quarter. The average IRA balance4 was $101,900 in Q3, a 24.9% decrease from Q3 2021, an 8% decrease from last quarter, and a 33% increase from ten years ago. The average 401(k) balance5 dropped below the six-figure mark to $97,200 this quarter, down 22.9% from a year ago, 6% from Q2 2022, and a 28% increase from ten years ago. The average 403(b) account balance6 decreased to $87,400, down 21% from a year ago, a decrease of 6% from last quarter, and a 48% increase from ten years ago.
Average Retirement Account Balances |
|||||||
|
Q3 2022 |
Q2 2022 |
Q3 2021 |
Q3 2012 |
|||
IRA |
$101,900 |
$110,800 |
$135,700 |
$76,800 |
|||
401(k) |
$97,200 |
$103,800 |
$126,100 |
$76,100 |
|||
403(b) |
$87,400 |
$93,300 |
$110,800 |
$59,200 |
|||
- Despite this, Gen Z 401(k) savers actually increased their balances slightly this quarter. Although their balances are relatively smaller, among Gen Z7 savers, who are heavily invested in target date funds, the average account balance actually increased by 1.2% over last quarter. As of Q3, 85% of Gen Z savers have all of their 401(k) savings in a target date fund. The use of target date funds as a default option continues to increase in popularity, with a 93.2% plan sponsor adoption rate in Q3 2022, up from 88.3% in Q3 2017, just five years ago.
-
The number of IRA4 accounts continues to increase, especially among Gen Z and Millennials7. The total number of Fidelity IRA accounts continues to climb, reaching 13.2 million, an 11.2% increase over Q3 of last year. The number of accounts reporting a contribution also increased by 2.3% year-to-date between Q3 2021 and Q3 2022. Across generations, Roths tend to be the retail retirement savings vehicle of choice, with 61% of all contributions going to a Roth in Q3 2022.
- Younger generations continue to lead the way, with the number of accounts for Gen Z increasing by 83% compared to Q3 2021 and the number of Millennial accounts increasing by 25%. In particular, Millennial Roth IRA accounts with a contribution increased by 5.8% year-to-date. In addition, younger generations (Gen Z and Millennial) now make up roughly half (45%) of the tax-exempt workforce.
- Account growth for females—who make up 45% of total IRA accounts—saw a year-over-year increase of 87% for Gen Z and 25% for Millennials.
- Total 401(k) savings rates continue to hold strong. The total savings rate for the third quarter, which reflects a combination of employer and employee 401(k) contributions, remained fairly steady at 13.8% (compared to 13.9% in Q2 2022 and 14.0% in Q1 2022), which is just below Fidelity's suggested savings rate of 15%. In fact, the majority of workers (86%) kept their savings account contributions unchanged; 7.8% actually increased their contribution rate. Men continued to save at higher rates than women (14.5% vs. 13.5%), while pre-retiree Boomers saved at the highest levels (16.5%). Gen Z participants increased their savings levels this quarter, moving from 10% to 10.3%.
- The majority of retirement savers still aren’t making changes to their asset allocation. Only 4.5% of 401(k) and 403(b) savers made a change to the asset allocation in the third quarter, less than the 5.0% that did so in Q2 and those who made a change in Q3 2021 (4.8%). Of the savers that made changes in Q3, about 85% only made one; the top change involved shifting savings to more conservative investments (29%).
- Outstanding 401(k) loans and average loan amounts continue to decline. Despite inflationary pressures, the percentage of 401(k) savers initiating a new loan continues to remain low, with only 2.4% of participants doing so in Q3. In addition, the percentage of participants with a loan outstanding remained at 16.7% for Q3 2022—a significant drop compared to 18.7% in Q3 2020 in the early days of the pandemic.
More Reasons to Keep Making Retirement Contributions During Volatile Times
For retirement savers justifiably concerned about the impact of market volatility, it may be reassuring to know there are important arguments that can reinforce one’s faith in looking long-term and not making changes based on short-term economic swings. These include:
- Unlocking employer contributions. Nearly 9 out 10 (88.2%) of 401(k) savers on Fidelity’s workplace platform receive some type of contribution to their workplace savings account, including profit sharing and matching contributions.
- Dollar-cost averaging. Workers who consistently contribute a set dollar amount into their workplace savings account can take advantage of the dollar-cost average strategy, which allows them to purchase more shares for their 401(k) and IRAs when prices are lower and fewer when they are higher.
- Tax benefits. Contributions to retirement savings plans can be made pre-tax or are tax deductible, so the amount you contribute to your savings reduces the amount of income that is subject to taxes this year.
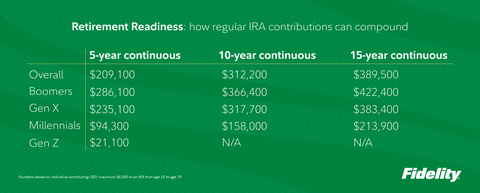
Finally, making continuous contributions over even a relatively short period of time can have a profound impact on one’s retirement readiness. For example, if you contributed the 2021 maximum $6,000 IRA contribution at age 25 and keep it going all the way to age 70, you would have amassed $1,440,5928 by retirement. Even shorter term, according to Fidelity’s analysis, the average 401(k) balance for individuals who have been in their same plan with the same employer for just a 5-year continuous period is more than double the average retirement account balance7:
“One additional way to increase retirement security for Americans is by addressing the other end of the spectrum—those millions of workers who change jobs and leave behind low retirement balances,” said Barry. “Job changing participants in this position often take no action to transfer their balances to a new service provider, meaning the account could simply be forgotten or prematurely cashed out and subject to taxes and penalties. Auto-portability can play a crucial role in increasing retirement security for these Americans by automating the movement of an inactive retirement account seamlessly into the active account of a new employer’s plan, potentially preserving trillions of dollars in future savings.”
For additional information on Fidelity’s Q3 2022 analysis, click here to access Fidelity’s “Building Financial Futures” overview, which provides additional details and insight on retirement trends and data. In addition, Fidelity also offers a variety of other resources to learn more about retirement planning, including helpful Viewpoints articles such as “How to take control of your retirement” and a new site dedicated to engaging the next generation of investors.
About Fidelity Investments
Fidelity’s mission is to inspire better futures and deliver better outcomes for the customers and businesses we serve. With assets under administration of $9.6 trillion, including discretionary assets of $3.6 trillion as of September 30, 2022, we focus on meeting the unique needs of a diverse set of customers. Privately held for over 75 years, Fidelity employs more than 60,000 associates who are focused on the long-term success of our customers. For more information about Fidelity Investments, visit https://www.fidelity.com/about-fidelity/our-company.
Keep in mind that investing involves risk. The value of your investment will fluctuate over time, and you may gain or lose money.
Past performance is no guarantee of future results.
Dollar cost averaging does not assure a profit or protect against loss in declining markets. It also involves continuous investment in securities, so you should consider your financial ability to continue your purchases through periods of low price levels.
Target Date Funds are an asset mix of stocks, bonds and other investments that automatically becomes more conservative as the fund approaches its target retirement date and beyond. Principal invested is not guaranteed.
# # #
Fidelity Brokerage Services LLC, Member NYSE, SIPC
900 Salem Street, Smithfield, RI 02917
Fidelity Distributors Company LLC,
500 Salem Street, Smithfield, RI 02917
National Financial Services LLC, Member NYSE, SIPC,
245 Summer Street, Boston, MA 02110
1059290.1.0
© 2022 FMR LLC. All rights reserved
_________________________
1 Fidelity Investments Q3 2022 Participant Wellbeing survey of 1513 Fidelity plan participants between Sep 08-17, 2022 |
2 Based on PLANSPONSOR Magazine's "2021 Recordkeeping Survey," June 2021 and "Plan Administration Guide, Part 1" which offers insight into the provider marketplace for defined benefit (DB), stock plan and health savings account (HSA) administration, May 2018. |
3 Based on Cerulli Associates’ “Top-10 IRA Providers by AUA, 4Q 2019 – 4Q 2021.” |
4 Fidelity business analysis of 13.2 million IRA accounts as of September 30, 2022. |
5 Analysis based on 24,500 corporate defined contribution plans and 22.1 million participants as of September 30, 2022. These figures include the advisor-sold market but exclude the tax-exempt market. Excluded from the behavioral statistics are non-qualified defined contribution plans and plans for Fidelity’s own employees |
6 Based on Fidelity analysis of 10,232 Tax-exempt plans and 7.8 million plan participants as of September 30, 2022. Considers average balance across all active plans for 5.8M unique individuals employed in tax-exempt market. |
7 Generations as defined by Pew Research: Gen Z (born 1997-2012), Millennials (1981-1996), Gen X (1965-1980) and Boomers (1946-1964). |


