


 YoY")
 PBT USD 1,453m, (4%) YoY")
 PBT CHF 430m, (2%) YoY")
 PBT USD 140m, (34%) YoY")
 PBT USD 447m, (47%) YoY")
m, compared with USD (180)m in 3Q21")
ZURICH & BASEL, Switzerland--(BUSINESS WIRE)--Regulatory News:
UBS: (NYSE:UBS) (SWX:UBSN):
UBS’s 3Q22 results materials are available at ubs.com/investors
The audio webcast of the earnings call starts at 09:00 CEST, 25 October 2022
A definition of each alternative performance measure, the method used to calculate it and the information content are presented under “Alternative performance measures” in the appendix to our 3Q22 report. |
Group highlights
-
We have strong momentum with our clients in challenging markets
Our proactive engagement with our clients led to positive momentum with USD 17bn net new fee-generating assets1 (NNFGA) in GWM, USD 18bn of net new money in AM (of which USD 2bn excluding money market flows), and CHF 0.4bn net new investment products in Personal Banking, an 8% annualized growth, amidst challenging market conditions. As clients repositioned their investments in response to fast and steep interest rate increases, we continued to actively manage our deposit base which resulted in a 14% YoY increase in net interest income across GWM and P&C. Client activity was differentiated across segments as institutional clients remained very active on the back of high volatility in foreign exchange and rates, whereas private investors remained generally on the sidelines.
In Americas, we attracted net new fee-generating assets of USD 4bn, we continued to see positive momentum in our SMA offering, which contributed USD 5bn net new money in AM, and we had a strong quarter in advisor recruiting.
In Switzerland, we saw CHF 2bn net new loans in GWM and P&C combined, primarily driven by mortgages.
In EMEA, our Global Markets business had its best 3Q on record, we generated USD 6bn net new fee-generating assets, and we completed the sale of our domestic wealth management business in Spain which further optimizes our footprint.
In APAC we saw USD 7bn net new fee-generating assets and we were #1 in ECM for non-domestic banks.
-
We delivered a good performance and are executing our strategy
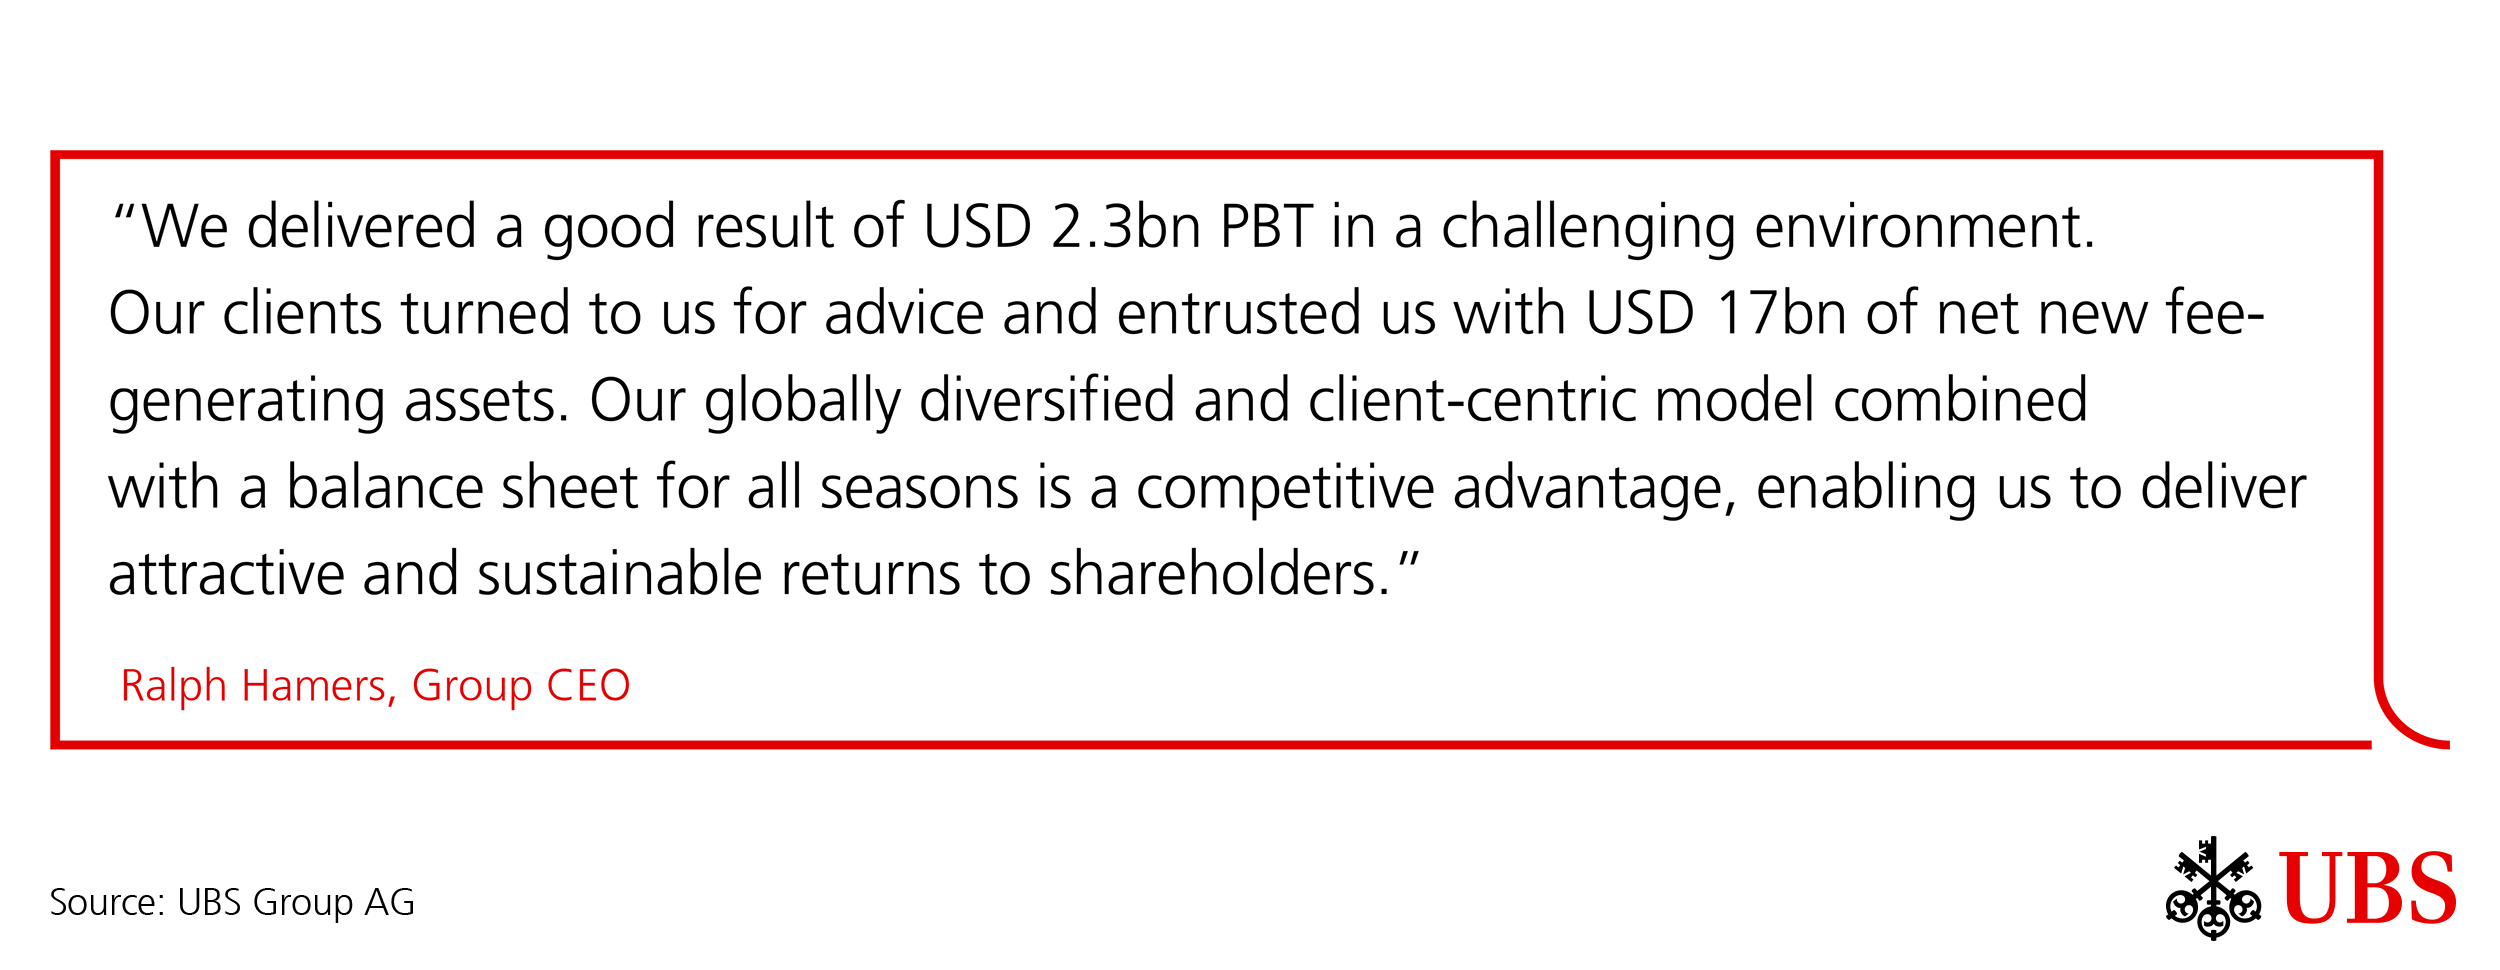
3Q22 PBT was USD 2,323m (down 19% YoY) compared to a particularly strong quarter in the previous year. The cost/income ratio was 71.8%. Total revenues were down 10% YoY, while operating expenses decreased by 6%. Net profit attributable to shareholders was USD 1,733m (down 24% YoY), with diluted earnings per share of USD 0.52. Return on CET1 capital was 15.5%. We repurchased USD 1.0bn of shares in 3Q22 and USD 4.3bn in the first 9 months of the year, and we expect to repurchase approximately USD 5.5bn of shares during 2022. Our exposure to rising interest rates across the globe and expense controls contributed to the quarter’s solid performance.
-
We maintained a strong balance sheet and disciplined risk management
In the quarter, we maintained a strong capital position with a CET1 capital ratio of 14.4% and a CET1 leverage ratio of 4.51%, both significantly in excess of our guidance of ~13% and >3.7%, respectively. Our balance sheet remains strong, with a high-quality loan book where 95% of our loans2 are collateralized, and with an average LTV of less than 55%. Our highly accretive, capital-light business model with a balance sheet for all seasons and disciplined risk management position us well to face the challenges of the current macroeconomic environment.
Ralph Hamers, UBS’s Group CEO
“The macroeconomic and geopolitical environment has become increasingly complex. Clients remain concerned about persistently high inflation, elevated energy prices, the war in Ukraine and residual effects of the pandemic. In Switzerland, many of our retail and small business clients will also be impacted by disruptions across the rest of Europe, and we are focused on supporting them through the energy crisis.
The impact of all this has been far-reaching – affecting asset levels, market volatility, rates and investor sentiment across the globe, and with this uncertainty clients turned to us for advice and solutions. They entrusted us with USD 17 billion of net new fee-generating assets in Global Wealth Management and USD 18 billion of net new money in Asset Management.
We continue to execute our strategy across all our key regions. In the US, we’re driving scale and productivity, improving profit before tax margins and positioning our business for future growth, all supported by strong advisor hiring. In APAC, we see strong growth opportunities and took steps to expand our Global Family and Institutional Wealth business in Southeast Asia. In Switzerland, the stability of our business is underpinned by continued solid growth. And in EMEA, we further optimized our footprint to drive efficiency and focus on growth.
For the quarter, we delivered good financial performance, with higher net interest income partly offsetting the impact of lower market levels and client activity. We remain disciplined on risk management and cost efficiency as we head into the fourth quarter.
With limited credit risk, a balance sheet for all seasons and a highly capital generative model, we remain confident in our ability to deliver attractive and sustainable capital returns to shareholders.”
Third quarter 2022 performance overview – Group
Group |
3Q22 |
9M22 |
Targets/guidance |
||||||||||||
Return on CET1 capital |
15.5% |
|
|
|
|
17.8% |
|
|
|
|
15–18% |
||||
Return on tangible equity |
13.9% |
|
|
|
|
15.4% |
|
|
|
|
|
||||
Cost/income ratio |
71.8% |
|
|
|
|
71.0% |
|
|
|
|
70–73% |
||||
Net profit attributable to shareholders |
USD 1.7bn |
|
|
|
|
USD 6.0bn |
|
|
|
|
|
||||
CET1 capital ratio |
14.4% |
|
|
|
|
14.4% |
|
|
|
|
~13% |
||||
CET1 leverage ratio |
4.51% |
|
|
|
|
4.51% |
|
|
|
|
>3.7% |
||||
Tangible book value per share |
USD 15.57 |
|
|
|
|
USD 15.57 |
|
|
|
|
|
||||
Buybacks |
USD 1.0bn |
|
|
|
|
USD 4.3bn |
|
|
|
|
USD ~5.5bn in FY22 |
Group PBT USD 2,323m, (19%) YoY
PBT was USD 2,323m, including net credit loss releases of USD 3m. The cost/income ratio was 71.8%, 3.1 percentage points higher YoY. Total revenues were down 10% YoY, while operating expenses decreased by 6%. Net profit attributable to shareholders was USD 1,733m (down 24% YoY), with diluted earnings per share of USD 0.52. Return on CET1 capital was 15.5%.
Third quarter 2022 performance overview – Business Divisions and Group Functions
Global Wealth Management |
3Q22 |
|
|
|
|
9M22 |
|
|
|
|
Targets/guidance |
||||
Profit before tax |
USD 1.5bn |
|
|
|
|
USD 3.9bn |
|
|
|
|
|
||||
PBT growth |
(4%) YoY |
|
|
|
|
(7%) YoY |
|
|
|
|
10–15% over the cycle |
||||
Invested assets |
USD 2.7trn |
|
|
|
|
USD 2.7trn |
|
|
|
|
|
||||
Net new fee-generating assets1 |
USD 17.1bn |
|
|
|
|
USD 36.9bn |
|
|
|
|
|
||||
|
|
|
|
|
|
|
|
|
|
|
|
||||
Personal & Corporate Banking |
|
|
|
|
|
|
|
|
|
|
|
||||
Profit before tax |
CHF 0.4bn |
|
|
|
|
CHF 1.2bn |
|
|
|
|
|
||||
Return on attributed equity (CHF) |
19% |
|
|
|
|
19% |
|
|
|
|
|
||||
Net new investment products for Personal Banking |
CHF 0.4bn |
|
|
|
|
CHF 1.9bn |
|
|
|
|
|
||||
|
|
|
|
|
|
|
|
|
|
|
|
||||
Asset Management |
|
|
|
|
|
|
|
|
|
|
|
||||
Profit before tax |
USD 0.1bn |
|
|
|
|
USD 1.3bn |
|
|
|
|
|
||||
Invested assets |
USD 1.0trn |
|
|
|
|
USD 1.0trn |
|
|
|
|
|
||||
Net new money excl. money markets |
USD 2.0bn |
|
|
|
|
USD 4.0bn |
|
|
|
|
|
||||
|
|
|
|
|
|
|
|
|
|
|
|
||||
Investment Bank |
|
|
|
|
|
|
|
|
|
|
|
||||
Profit before tax |
USD 0.4bn |
|
|
|
|
USD 1.8bn |
|
|
|
|
|
||||
Return on attributed equity |
14% |
|
|
|
|
18% |
|
|
|
|
|
||||
RWA and LRD vs. Group |
30% / 31% |
|
|
|
|
30% / 31% |
|
|
|
|
Up to 1/3 |
Global Wealth Management (GWM) PBT USD 1,453m, (4%) YoY
Total revenues decreased by 4% YoY to USD 4,786m, including a USD 133m gain from the sale of our domestic wealth management business in Spain and an USD 86m gain from the sale of UBS Swiss Financial Advisers AG. 3Q21 included a USD 100m gain from the sale of our domestic wealth management business in Austria. Net interest income increased by 23%, mainly reflecting higher deposit revenues, which were driven by higher deposit margins, as a result of rising interest rates, and despite a decrease in deposit volumes. Recurring net fee income decreased by 14%, primarily driven by negative market performance and foreign currency effects, partly offset by incremental revenues from net new fee-generating assets. Transaction-based income decreased by 18%, mainly driven by lower levels of client activity across all regions. Net credit loss expenses were USD 7m, compared with net releases of USD 11m in 3Q21. Operating expenses were down 5%, mainly driven by a decrease in personnel expenses, primarily as a result of lower financial advisor variable compensation. The cost/income ratio was 69.5%, down 0.3 percentage points YoY. Fee-generating assets were down 5% sequentially to USD 1,182bn. Net new fee-generating assets1 were USD 17.1bn.
Personal & Corporate Banking (P&C) PBT CHF 430m, (2%) YoY
Total revenues increased by CHF 5m YoY. Net interest income decreased by 1%, mainly driven by a lower benefit from the Swiss National Bank deposit exemption and lower deposit fees, largely offset by higher deposit margins as a result of rising interest rates. Recurring net fee income increased by 3%, mostly driven by higher revenues from account fees. Transaction-based income increased by 2% on higher revenues from FX and credit card transactions, reflecting higher spending by clients, and a gain in relation to the sale of an equity investment. Net credit loss releases were CHF 15m, compared with net releases of CHF 6m in 3Q21. Operating expenses increased by 4%, mainly driven by higher investments in technology, expenses for marketing, and donations. The cost/income ratio was 58.5%, 2.0 percentage points higher YoY.
Asset Management (AM) PBT USD 140m, (34%) YoY
Total revenues were down 13% YoY. Net management fees decreased by 10%, primarily reflecting negative market performance and foreign currency effects. Performance fees decreased by USD 19m, mainly in our Hedge Fund Businesses and Equities. Operating expenses were broadly stable, with favorable foreign currency effects and lower litigation expenses being almost entirely offset by increases in expenses for technology, personnel and travel. The cost/income ratio was 72.8%, 8.9 percentage points higher YoY. Invested assets decreased by 5% sequentially to USD 979bn. Net new money was USD 17.9bn (of which USD 2.0bn excluding money market flows, driven by Fixed Income).
Investment Bank (IB) PBT USD 447m, (47%) YoY
Total revenues decreased by 19%. Global Markets revenues decreased by USD 21m, or 1%, with lower Equity Derivatives, Cash Equities and Financing revenues being largely offset by higher revenues in Foreign Exchange and Rates. Global Banking revenues decreased by USD 463m, or 58%, mostly driven by lower Capital Markets revenues. Operating expenses decreased by 6%, mainly driven by favorable foreign currency effects, partly offset by higher expenses on technology. The cost/income ratio was 77.8%, 11.3 percentage points higher YoY. Return on attributed equity was 14.0%.
Group Functions PBT USD (158)m, compared with USD (180)m in 3Q21
Extending UBS’s leadership in sustainable finance
Sustainable finance has long been a firm-wide priority at UBS. We aim to offer solutions to help private and institutional clients meet their investment objectives, including through sustainable finance. In addition, we want to be the provider of choice for clients who wish to mobilize capital toward the achievement of the United Nations 17 Sustainable Development Goals (UN SDGs).
Driving positive change for clients and communities
We supported our clients’ investment and sustainability goals with alternative and tailored investment solutions. UBS, together with selected family offices and a pension manager, completed a USD 700m fund to develop energy- efficient cold storage facilities across the United States.
We also raised GBP 400m to develop life sciences facilities in the UK. These facilities are expected to create skilled employment opportunities for local economies in addition to advancing healthcare.
In collaboration with Essex Pension Fund and Hymans Robertson, we launched an investment fund specifically tailored to meet Essex Pension Fund’s objectives to invest in companies leading the transition to a low-carbon economy. In addition, the investment fund makes a positive social contribution by favoring companies that align with five of the UN SDGs.
Facilitating the energy transition
In July, Nant de Drance, a 900 MW pumped storage power plant in Valais, Switzerland, commenced operations, supporting the energy transition in Switzerland. UBS led various capital market financing for this project over its 14 years of construction.
We also announced long-term collaborations with two companies pioneering new carbon removal technologies. Over the next 13 years, these companies aim to remove an aggregate of 39,500 metric tons of CO₂ from the atmosphere. For reference, UBS’s 2021 net scope 1 and 2 greenhouse gas emissions were 14,300 metric tons of CO₂ equivalent.
Supporting refugees of the war in Ukraine
As of 30 September 2022, the UBS Optimus Foundation Ukraine Relief Fund had disbursed almost half of the more than USD 50m committed by clients, employees, UBS and our strategic partner XTX Markets for relief and recovery efforts in response to the war in Ukraine. The Fund is supporting a range of organizations and their local partners in Ukraine and the neighboring countries of Poland, Moldova and Romania. These organizations include the International Rescue Committee and its partners, which had reached more than 14,000 families with emergency cash support and 7,600 people with essential goods as of the end of September 2022.
Information in this news release is presented for UBS Group AG on a consolidated basis unless otherwise specified. Financial information for UBS AG (consolidated) does not differ materially from UBS Group AG (consolidated) and a comparison between UBS Group AG (consolidated) and UBS AG (consolidated) is provided at the end of this news release. |
1 Net new fee-generating assets exclude the effects on fee-generating assets of strategic decisions by UBS to exit markets or services. |
2 Loans and advances to customers. |
Our key figures |
||||||||
|
|
As of or for the quarter ended |
|
As of or year-to-date |
||||
USD m, except where indicated |
|
30.9.22 |
30.6.22 |
31.12.21 |
30.9.21 |
|
30.9.22 |
30.9.21 |
Group results |
|
|
|
|
|
|
|
|
Total revenues |
|
8,236 |
8,917 |
8,705 |
9,115 |
|
26,534 |
26,689 |
Credit loss expense / (release) |
|
(3) |
7 |
(27) |
(14) |
|
22 |
(121) |
Operating expenses |
|
5,916 |
6,295 |
7,003 |
6,264 |
|
18,845 |
19,054 |
Operating profit / (loss) before tax |
|
2,323 |
2,615 |
1,729 |
2,865 |
|
7,667 |
7,755 |
Net profit / (loss) attributable to shareholders |
|
1,733 |
2,108 |
1,348 |
2,279 |
|
5,977 |
6,109 |
Diluted earnings per share (USD)1 |
|
0.52 |
0.61 |
0.38 |
0.63 |
|
1.74 |
1.68 |
Profitability and growth2 |
|
|
|
|
|
|
|
|
Return on equity (%) |
|
12.3 |
14.6 |
8.9 |
15.3 |
|
13.7 |
13.8 |
Return on tangible equity (%) |
|
13.9 |
16.4 |
10.0 |
17.2 |
|
15.4 |
15.5 |
Return on common equity tier 1 capital (%) |
|
15.5 |
18.9 |
11.9 |
20.8 |
|
17.8 |
19.5 |
Return on leverage ratio denominator, gross (%) |
|
3.3 |
3.4 |
3.3 |
3.5 |
|
3.4 |
3.4 |
Cost / income ratio (%) |
|
71.8 |
70.6 |
80.5 |
68.7 |
|
71.0 |
71.4 |
Effective tax rate (%) |
|
25.0 |
19.0 |
21.4 |
20.1 |
|
21.7 |
21.0 |
Net profit growth (%) |
|
(24.0) |
5.1 |
(17.6) |
8.9 |
|
(2.2) |
24.2 |
Resources2 |
|
|
|
|
|
|
|
|
Total assets |
|
1,111,753 |
1,113,193 |
1,117,182 |
1,088,773 |
|
1,111,753 |
1,088,773 |
Equity attributable to shareholders |
|
55,756 |
56,845 |
60,662 |
60,219 |
|
55,756 |
60,219 |
Common equity tier 1 capital3 |
|
44,664 |
44,798 |
45,281 |
45,022 |
|
44,664 |
45,022 |
Risk-weighted assets3 |
|
310,615 |
315,685 |
302,209 |
302,426 |
|
310,615 |
302,426 |
Common equity tier 1 capital ratio (%)3 |
|
14.4 |
14.2 |
15.0 |
14.9 |
|
14.4 |
14.9 |
Going concern capital ratio (%)3 |
|
19.1 |
19.0 |
20.0 |
20.0 |
|
19.1 |
20.0 |
Total loss-absorbing capacity ratio (%)3 |
|
33.7 |
33.7 |
34.7 |
34.0 |
|
33.7 |
34.0 |
Leverage ratio denominator3 |
|
989,787 |
1,025,422 |
1,068,862 |
1,044,916 |
|
989,787 |
1,044,916 |
Common equity tier 1 leverage ratio (%)3 |
|
4.51 |
4.37 |
4.24 |
4.31 |
|
4.51 |
4.31 |
Liquidity coverage ratio (%) |
|
162.7 |
160.8 |
155.5 |
157.3 |
|
162.7 |
157.3 |
Net stable funding ratio (%) |
|
120.4 |
120.9 |
118.5 |
118.1 |
|
120.4 |
118.1 |
Other |
|
|
|
|
|
|
|
|
Invested assets (USD bn)4 |
|
3,706 |
3,912 |
4,596 |
4,432 |
|
3,706 |
4,432 |
Personnel (full-time equivalents) |
|
72,009 |
71,294 |
71,385 |
71,427 |
|
72,009 |
71,427 |
Market capitalization1 |
|
46,674 |
52,475 |
61,230 |
55,423 |
|
46,674 |
55,423 |
Total book value per share (USD)1 |
|
17.52 |
17.45 |
17.84 |
17.48 |
|
17.52 |
17.48 |
Tangible book value per share (USD)1 |
|
15.57 |
15.51 |
15.97 |
15.62 |
|
15.57 |
15.62 |
1 Refer to the “Share information and earnings per share” section of the UBS Group third quarter 2022 report for more information. 2 Refer to the “Targets, aspirations and capital guidance” section of our Annual Report 2021 for more information about our performance targets. 3 Based on the Swiss systemically relevant bank framework as of 1 January 2020. Refer to the “Capital management” section of the UBS Group third quarter 2022 report for more information. 4 Consists of invested assets for Global Wealth Management, Asset Management and Personal & Corporate Banking. Refer to “Note 32 Invested assets and net new money” in the “Consolidated financial statements” section of our Annual Report 2021 for more information.
|
||||||||
Income statement |
|
|
|
|
|
|
|
|
|
|
|
|
For the quarter ended |
|
% change from |
|
Year-to-date |
||||
USD m |
|
30.9.22 |
30.6.22 |
30.9.21 |
|
2Q22 |
3Q21 |
|
30.9.22 |
30.9.21 |
Net interest income |
|
1,596 |
1,665 |
1,693 |
|
(4) |
(6) |
|
5,032 |
4,934 |
Other net income from financial instruments measured at fair value through profit or loss |
|
1,796 |
1,619 |
1,697 |
|
11 |
6 |
|
5,641 |
4,485 |
Net fee and commission income |
|
4,481 |
4,774 |
5,610 |
|
(6) |
(20) |
|
14,608 |
16,858 |
Other income |
|
363 |
859 |
115 |
|
(58) |
216 |
|
1,254 |
412 |
Total revenues |
|
8,236 |
8,917 |
9,115 |
|
(8) |
(10) |
|
26,534 |
26,689 |
|
|
|
|
|
|
|
|
|
|
|
Credit loss expense / (release) |
|
(3) |
7 |
(14) |
|
|
(79) |
|
22 |
(121) |
|
|
|
|
|
|
|
|
|
|
|
Personnel expenses |
|
4,216 |
4,422 |
4,598 |
|
(5) |
(8) |
|
13,559 |
14,170 |
General and administrative expenses |
|
1,192 |
1,370 |
1,148 |
|
(13) |
4 |
|
3,769 |
3,340 |
Depreciation, amortization and impairment of non-financial assets |
|
508 |
503 |
518 |
|
1 |
(2) |
|
1,517 |
1,544 |
Operating expenses |
|
5,916 |
6,295 |
6,264 |
|
(6) |
(6) |
|
18,845 |
19,054 |
Operating profit / (loss) before tax |
|
2,323 |
2,615 |
2,865 |
|
(11) |
(19) |
|
7,667 |
7,755 |
Tax expense / (benefit) |
|
580 |
497 |
576 |
|
17 |
1 |
|
1,662 |
1,629 |
Net profit / (loss) |
|
1,742 |
2,118 |
2,289 |
|
(18) |
(24) |
|
6,005 |
6,127 |
Net profit / (loss) attributable to non-controlling interests |
|
9 |
10 |
9 |
|
(10) |
2 |
|
28 |
18 |
Net profit / (loss) attributable to shareholders |
|
1,733 |
2,108 |
2,279 |
|
(18) |
(24) |
|
5,977 |
6,109 |
|
|
|
|
|
|
|
|
|
|
|
Comprehensive income |
|
|
|
|
|
|
|
|
|
|
Total comprehensive income |
|
(48) |
1,079 |
1,678 |
|
|
|
|
960 |
3,941 |
Total comprehensive income attributable to non-controlling interests |
|
(8) |
(17) |
(5) |
|
(55) |
68 |
|
1 |
6 |
Total comprehensive income attributable to shareholders |
|
(40) |
1,097 |
1,683 |
|
|
|
|
959 |
3,935 |
Comparison between UBS Group AG consolidated and UBS AG consolidated |
|
|
|
|
|
|
|
|
||||
|
|
As of or for the quarter ended 30.9.22 |
|
As of or for the quarter ended 30.6.22 |
|
As of or for the quarter ended 31.12.21 |
||||||
USD m, except where indicated |
|
UBS Group AG
|
UBS AG
|
Difference
|
|
UBS Group AG
|
UBS AG
|
Difference
|
|
UBS Group AG
|
UBS AG
|
Difference
|
|
|
|
|
|
|
|
|
|
|
|
|
|
Income statement |
|
|
|
|
|
|
|
|
|
|
|
|
Total revenues |
|
8,236 |
8,308 |
(73) |
|
8,917 |
9,036 |
(119) |
|
8,705 |
8,819 |
(114) |
Credit loss expense / (release) |
|
(3) |
(3) |
0 |
|
7 |
7 |
0 |
|
(27) |
(27) |
0 |
Operating expenses |
|
5,916 |
6,152 |
(236) |
|
6,295 |
6,577 |
(282) |
|
7,003 |
7,227 |
(224) |
Operating profit / (loss) before tax |
|
2,323 |
2,159 |
164 |
|
2,615 |
2,452 |
163 |
|
1,729 |
1,619 |
109 |
of which: Global Wealth Management |
|
1,453 |
1,434 |
18 |
|
1,157 |
1,130 |
27 |
|
563 |
541 |
22 |
of which: Personal & Corporate Banking |
|
442 |
437 |
5 |
|
413 |
409 |
4 |
|
365 |
362 |
3 |
of which: Asset Management |
|
140 |
139 |
1 |
|
959 |
959 |
0 |
|
334 |
328 |
6 |
of which: Investment Bank |
|
447 |
436 |
11 |
|
410 |
388 |
22 |
|
713 |
710 |
3 |
of which: Group Functions |
|
(158) |
(287) |
129 |
|
(324) |
(433) |
110 |
|
(246) |
(321) |
75 |
Net profit / (loss) |
|
1,742 |
1,608 |
135 |
|
2,118 |
1,974 |
144 |
|
1,359 |
1,266 |
93 |
of which: net profit / (loss) attributable to shareholders |
|
1,733 |
1,598 |
135 |
|
2,108 |
1,964 |
144 |
|
1,348 |
1,255 |
93 |
of which: net profit / (loss) attributable to non-controlling interests |
|
9 |
9 |
0 |
|
10 |
10 |
0 |
|
11 |
11 |
0 |
|
|
|
|
|
|
|
|
|
|
|
|
|
Statement of comprehensive income |
|
|
|
|
|
|
|
|
|
|
|
|
Other comprehensive income |
|
(1,791) |
(1,753) |
(38) |
|
(1,039) |
(1,009) |
(30) |
|
(181) |
(197) |
16 |
of which: attributable to shareholders |
|
(1,773) |
(1,735) |
(38) |
|
(1,011) |
(981) |
(30) |
|
(177) |
(194) |
16 |
of which: attributable to non-controlling interests |
|
(17) |
(17) |
0 |
|
(28) |
(28) |
0 |
|
(4) |
(4) |
0 |
Total comprehensive income |
|
(48) |
(145) |
97 |
|
1,079 |
965 |
114 |
|
1,178 |
1,069 |
109 |
of which: attributable to shareholders |
|
(40) |
(137) |
97 |
|
1,097 |
982 |
114 |
|
1,171 |
1,062 |
109 |
of which: attributable to non-controlling interests |
|
(8) |
(8) |
0 |
|
(17) |
(17) |
0 |
|
7 |
7 |
0 |
|
|
|
|
|
|
|
|
|
|
|
|
|
Balance sheet |
|
|
|
|
|
|
|
|
|
|
|
|
Total assets |
|
1,111,753 |
1,111,926 |
(172) |
|
1,113,193 |
1,112,474 |
719 |
|
1,117,182 |
1,116,145 |
1,037 |
Total liabilities |
|
1,055,666 |
1,056,985 |
(1,319) |
|
1,056,010 |
1,057,390 |
(1,380) |
|
1,056,180 |
1,057,702 |
(1,522) |
Total equity |
|
56,087 |
54,941 |
1,146 |
|
57,184 |
55,085 |
2,099 |
|
61,002 |
58,442 |
2,559 |
of which: equity attributable to shareholders |
|
55,756 |
54,610 |
1,146 |
|
56,845 |
54,746 |
2,099 |
|
60,662 |
58,102 |
2,559 |
of which: equity attributable to non-controlling interests |
|
330 |
330 |
0 |
|
339 |
339 |
0 |
|
340 |
340 |
0 |
|
|
|
|
|
|
|
|
|
|
|
|
|
Capital information |
|
|
|
|
|
|
|
|
|
|
|
|
Common equity tier 1 capital |
|
44,664 |
42,064 |
2,600 |
|
44,798 |
42,317 |
2,481 |
|
45,281 |
41,594 |
3,687 |
Going concern capital |
|
59,359 |
55,733 |
3,626 |
|
59,907 |
56,359 |
3,548 |
|
60,488 |
55,434 |
5,054 |
Risk-weighted assets |
|
310,615 |
308,571 |
2,044 |
|
315,685 |
313,448 |
2,238 |
|
302,209 |
299,005 |
3,204 |
Common equity tier 1 capital ratio (%) |
|
14.4 |
13.6 |
0.7 |
|
14.2 |
13.5 |
0.7 |
|
15.0 |
13.9 |
1.1 |
Going concern capital ratio (%) |
|
19.1 |
18.1 |
1.0 |
|
19.0 |
18.0 |
1.0 |
|
20.0 |
18.5 |
1.5 |
Total loss-absorbing capacity ratio (%) |
|
33.7 |
32.8 |
1.0 |
|
33.7 |
32.8 |
0.9 |
|
34.7 |
33.3 |
1.3 |
Leverage ratio denominator |
|
989,787 |
989,909 |
(122) |
|
1,025,422 |
1,024,811 |
612 |
|
1,068,862 |
1,067,679 |
1,183 |
Common equity tier 1 leverage ratio (%) |
|
4.51 |
4.25 |
0.26 |
|
4.37 |
4.13 |
0.24 |
|
4.24 |
3.90 |
0.34 |
Information about results materials and the earnings call
UBS’s third quarter 2022 report, news release and slide presentation are available from 06:45 CEST on Tuesday, 25 October 2022, at ubs.com/quarterlyreporting.
UBS will hold a presentation of its third quarter 2022 results on Tuesday, 25 October 2022. The results will be presented by Ralph Hamers (Group Chief Executive Officer), Sarah Youngwood (Group Chief Financial Officer), Sarah Mackey (Head of Investor Relations), and Marsha Askins (Head Communications & Branding).
Time
09:00 CEST
08:00 BST
03:00 US EDT
Audio webcast
The presentation for analysts can be followed live on ubs.com/quarterlyreporting with a simultaneous slide show.
Webcast playback
An audio playback of the results presentation will be made available at ubs.com/investors later in the day.
Cautionary Statement Regarding Forward-Looking Statements
This news release contains statements that constitute “forward-looking statements,” including but not limited to management’s outlook for UBS’s financial performance, statements relating to the anticipated effect of transactions and strategic initiatives on UBS’s business and future development and goals or intentions to achieve climate, sustainability and other social objectives. While these forward-looking statements represent UBS’s judgments, expectations and objectives concerning the matters described, a number of risks, uncertainties and other important factors could cause actual developments and results to differ materially from UBS’s expectations. Russia’s invasion of Ukraine has led to heightened volatility across global markets, to the coordinated implementation of sanctions on Russia and Belarus, Russian and Belarusian entities and nationals, and to heightened political tensions across the globe. In addition, the war has caused significant population displacement, and if the conflict continues, the scale of disruption will increase and may come to include wide-scale shortages of vital commodities, including causing energy shortages and food insecurity. The speed of implementation and extent of sanctions, as well as the uncertainty as to how the situation will develop, may have significant adverse effects on the market and macroeconomic conditions, including in ways that cannot be anticipated. This creates significantly greater uncertainty about forward-looking statements. Other factors that may affect our performance and ability to achieve our plans, outlook and other objectives also include, but are not limited to: (i) the degree to which UBS is successful in the ongoing execution of its strategic plans, including its cost reduction and efficiency initiatives and its ability to manage its levels of risk-weighted assets (RWA) and leverage ratio denominator (LRD), liquidity coverage ratio and other financial resources, including changes in RWA assets and liabilities arising from higher market volatility; (ii) the degree to which UBS is successful in implementing changes to its businesses to meet changing market, regulatory and other conditions; (iii) increased interest rate volatility in major markets; (iv) developments in the macroeconomic climate and in the markets in which UBS operates or to which it is exposed, including movements in securities prices or liquidity, credit spreads, and currency exchange rates, the effects of economic conditions, including increasing inflationary pressures, market developments, and increasing geopolitical tensions, and changes to national trade policies on the financial position or creditworthiness of UBS’s clients and counterparties, as well as on client sentiment and levels of activity, including the COVID-19 pandemic and the measures taken to manage it, which have had and may also continue to have a significant adverse effect on global and regional economic activity, including disruptions to global supply chains and labor market displacements; (v) changes in the availability of capital and funding, including any changes in UBS’s credit spreads and ratings, as well as availability and cost of funding to meet requirements for debt eligible for total loss-absorbing capacity (TLAC); (vi) changes in central bank policies or the implementation of financial legislation and regulation in Switzerland, the US, the UK, the European Union and other financial centers that have imposed, or resulted in, or may do so in the future, more stringent or entity-specific capital, TLAC, leverage ratio, net stable funding ratio, liquidity and funding requirements, heightened operational resilience requirements, incremental tax requirements, additional levies, limitations on permitted activities, constraints on remuneration, constraints on transfers of capital and liquidity and sharing of operational costs across the Group or other measures, and the effect these will or would have on UBS’s business activities; (vii) UBS’s ability to successfully implement resolvability and related regulatory requirements and the potential need to make further changes to the legal structure or booking model of UBS Group in response to legal and regulatory requirements, or other external developments; (viii) UBS’s ability to maintain and improve its systems and controls for complying with sanctions in a timely manner and for the detection and prevention of money laundering to meet evolving regulatory requirements and expectations, in particular in current geopolitical turmoil; (ix) the uncertainty arising from domestic stresses in certain major economies; (x) changes in UBS’s competitive position, including whether differences in regulatory capital and other requirements among the major financial centers adversely affect UBS’s ability to compete in certain lines of business; (xi) changes in the standards of conduct applicable to our businesses that may result from new regulations or new enforcement of existing standards, including measures to impose new and enhanced duties when interacting with customers and in the execution and handling of customer transactions; (xii) the liability to which UBS may be exposed, or possible constraints or sanctions that regulatory authorities might impose on UBS, due to litigation, contractual claims and regulatory investigations, including the potential for disqualification from certain businesses, potentially large fines or monetary penalties, or the loss of licenses or privileges as a result of regulatory or other governmental sanctions, as well as the effect that litigation, regulatory and similar matters have on the operational risk component of our RWA, as well as the amount of capital available for return to shareholders; (xiii) the effects on UBS’s business, in particular cross-border banking, of sanctions, tax or regulatory developments and of possible changes in UBS’s policies and practices; (xiv) UBS’s ability to retain and attract the employees necessary to generate revenues and to manage, support and control its businesses, which may be affected by competitive factors; (xv) changes in accounting or tax standards or policies, and determinations or interpretations affecting the recognition of gain or loss, the valuation of goodwill, the recognition of deferred tax assets and other matters; (xvi) UBS’s ability to implement new technologies and business methods, including digital services and technologies, and ability to successfully compete with both existing and new financial service providers, some of which may not be regulated to the same extent; (xvii) limitations on the effectiveness of UBS’s internal processes for risk management, risk control, measurement and modeling, and of financial models generally; (xviii) the occurrence of operational failures, such as fraud, misconduct, unauthorized trading, financial crime, cyberattacks, data leakage and systems failures, the risk of which is increased with cyberattack threats from nation states; (xix) restrictions on the ability of UBS Group AG to make payments or distributions, including due to restrictions on the ability of its subsidiaries to make loans or distributions, directly or indirectly, or, in the case of financial difficulties, due to the exercise by FINMA or the regulators of UBS’s operations in other countries of their broad statutory powers in relation to protective measures, restructuring and liquidation proceedings; (xx) the degree to which changes in regulation, capital or legal structure, financial results or other factors may affect UBS’s ability to maintain its stated capital return objective; (xxi) uncertainty over the scope of actions that may be required by UBS, governments and others to achieve goals relating to climate, environmental and social matters, as well as the evolving nature of underlying science and industry and the possibility of conflict between different governmental standards and regulatory regimes; and (xxii) the effect that these or other factors or unanticipated events may have on our reputation and the additional consequences that this may have on our business and performance. The sequence in which the factors above are presented is not indicative of their likelihood of occurrence or the potential magnitude of their consequences. Our business and financial performance could be affected by other factors identified in our past and future filings and reports, including those filed with the US Securities and Exchange Commission (the SEC). More detailed information about those factors is set forth in documents furnished by UBS and filings made by UBS with the SEC, including UBS’s Annual Report on Form 20-F for the year ended 31 December 2021. UBS is not under any obligation to (and expressly disclaims any obligation to) update or alter its forward-looking statements, whether as a result of new information, future events, or otherwise.
Rounding
Numbers presented throughout this news release may not add up precisely to the totals provided in the tables and text. Percentages and percent changes disclosed in text and tables are calculated on the basis of unrounded figures. Absolute changes between reporting periods disclosed in the text, which can be derived from numbers presented in related tables, are calculated on a rounded basis.
Tables
Within tables, blank fields generally indicate non-applicability or that presentation of any content would not be meaningful, or that information is not available as of the relevant date or for the relevant period. Zero values generally indicate that the respective figure is zero on an actual or rounded basis. Values that are zero on a rounded basis can be either negative or positive on an actual basis.