BELLEVUE, Wash.--(BUSINESS WIRE)--New data from USAFacts paints a portrait of who is getting vaccinated for COVID-19 in the US — a portrait that’s uneven, varying by state, age, sex, and race. This is just some of the data available in the new Vaccine Tracker, part of the expanded COVID-19 Data Hub at USAFacts.org.
According to USAFacts President Poppy MacDonald, “This vaccine tracker is a tool for Americans to determine how well our nation is responding to the pandemic. Our metrics show that the nation is making overall progress distributing vaccines — and that there are some clear disparities between demographics. The tracker enables users to step back and compare dozens of state vaccination efforts against one another and advocate for timely, fair and equitable distribution based on the numbers.”
USAFacts’ COVID data is updated daily. Visit USAFacts for latest numbers.
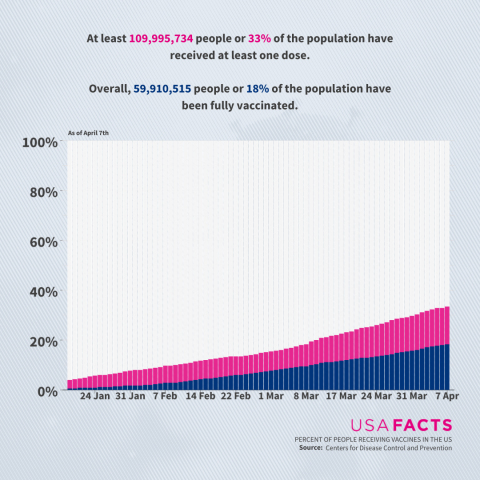
What's the nation's progress on vaccinations? (Visit charts for a detailed view)
As of April 6:
- At least 107,515,428 people (32% of the population) received at least one dose.
- Overall, 58,215,702 people (17% of the population) are fully vaccinated.
- 207,891,395 doses have been distributed in the US, with 167,187,795 of them (or 80%) used.
COVID-19 vaccinations differ by sex (Visit charts for a detailed view)
- More females are getting vaccinated than males (females: first dose 34%/ fully vaccinated 20%; males: first dose 28%/ fully vaccinated 15%).
What percentage of people in each age range received the vaccine? (Visit charts for a detailed view)
- The current data shows that the older an American is, the more likely they are to be vaccinated.
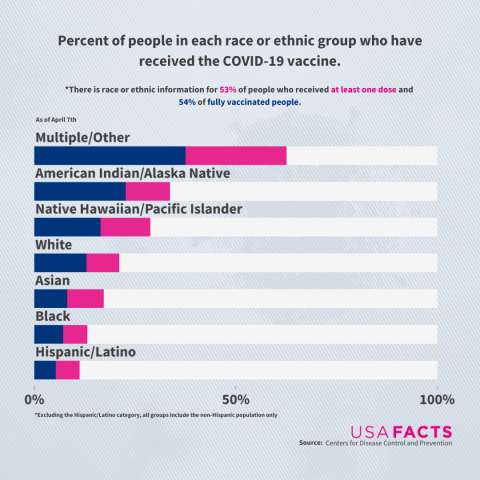
What percentage of people by race/ethnic group received the vaccine? (Visit charts for a detailed view)
The CDC has race or ethnic information for 53% of people who received at least one dose and 53% of fully vaccinated people. The chart below reveals a paucity of race data — there are hurdles in collecting these metrics, including inconsistent collection of race and ethnicity information at the time of vaccination and jurisdictional policies/laws that don’t allow for demographic data reporting. Despite these gaps, USAFacts is able to provide a portrait for millions of vaccinated Americans, and it reveals vaccination disparities by race.
- Black people made up 12.1% of the workforce in 2020, but they comprised 25.3% of vaccine-prioritized healthcare occupations. And while Hispanic people made up 17.6% of the workforce, they made up 43% of workers in farming, fishing, and forestry, jobs many states prioritized for the vaccine.
- Despite this, and the fact that Black and Hispanic Americans are more likely than white Americans to have many of the health conditions that permit early vaccination, the share of vaccinated Black and Hispanic people in the population lags behind.
- The majority of vaccinated people identify as American Indians/Alaska Native, Native Hawaiian/Pacific Islander, or multiple/other.
Track Your State’s Progress (Visit charts for a detailed view)
The State by State tracker lets users dig into the data to track how many people have received one shot or are fully vaccinated in their state. They can also track how many shots have been distributed and administered on a state level, plus who is currently eligible.
- Americans in New Mexico (41%), Connecticut (38%), and New Hampshire (41%) have received more first dose than any other state.
- New Mexico leads the nation in fully vaccinated residents (24%).
- Alabama and Mississippi have the fewest citizens with one dose (25%).
In recent months, other data sources Americans turned to for pandemic facts, including the popular Atlantic COVID Tracking Project, ceased reporting, rendering USAFacts one of the few sources for trusted COVID-19 data.
USAFacts is committed to updating its vaccination data as distribution progresses for as clear a portrait as possible. Members of the media and others interested in accessing or integrating this data, may contact info@usafacts.org.
About USAFacts
USAFacts is a not-for-profit, nonpartisan civic initiative making government data easy for all Americans to access and understand. USAFacts provides engaging visuals on data and trends in US spending, revenue, demographics, and policy outcomes to help Americans ground public debate in facts. It produces topical content throughout the year and has produced annual reports and 10-Ks on the nation. Follow them on Twitter, Facebook, and Instagram at @USAFacts, and sign up for the data-driven newsletter at www.usafacts.org.


