
")

SAN FRANCISCO--(BUSINESS WIRE)--HouseCanary, Inc. (“HouseCanary”), a leading provider of residential real estate data and home valuations, today released its latest Market Pulse report, covering 22 listing-derived metrics and comparing data between the week ending October 9, 2020 and the week ending March 13, 2020 versus the same period in 2019. The Market Pulse is an ongoing review of proprietary data and insights from HouseCanary’s nationwide platform.
Jeremy Sicklick, Co-founder and Chief Executive Officer of HouseCanary, commented: “As the election draws near, buyers and sellers appear to remain in a holding pattern with the single-family residential listing market showing little deviation from trends we have been observing over the past few weeks. While fluctuations in demand are following seasonal patterns, supply levels are drastically underperforming versus cyclical norms. Competitive bidding wars stemming from persistent tight supply have posed a challenge to first-time buyers searching for homes in lower price tiers as transaction prices have been driven up across the country. The result of the upcoming election may have the potential to throw the housing market recovery off its current course – especially as the CARES Act moratorium is set to expire at the start of 2021, which could potentially lead to a flood of supply being released into the market.”
Select findings from this week’s Market Pulse are below. Be sure to review the Market Pulse in full for extensive state-level data.
Total Net New Listings:
- Since the week ending March 13, there have been 1,854,883 net new listings placed on the market, representing an 8.5% decrease relative to the same period in 2019
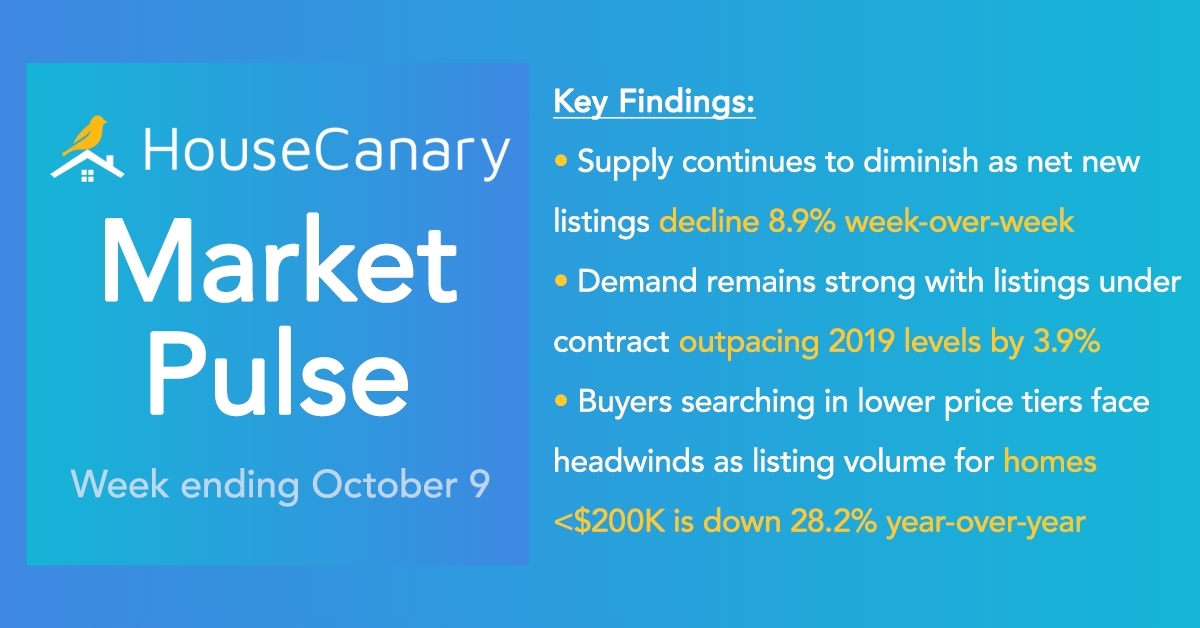
- For the week ending October 9, there were 47,610 net new listings placed on the market, representing an 8.9% decrease compared to the previous week
-
Percentage of total net new listings since March 13, broken down by home price:
- $0-$200k: 22.2%
- $200k-$400k: 44.5%
- $400k-$600k: 17.9%
- $600k-$1mm: 10.4%
- >$1mm: 5.0%
Weekly New Listing Volume (Single-Family Detached Homes):
- New listing volume is down 5.3% week-over-week
-
Percent change in new listing activity since the week ending March 13 versus the same period in 2019, broken down by home price:
- $0-$200k: (-28.2%)
- $200k-$400k: (-11.5%)
- $400k-$600k: (-2.1%)
- $600k-$1mm: +3.3%
- >$1mm: +6.7%
Weekly Contract Volume (Single-Family Detached Homes):
- Weekly contract volume is down 7.6% week-over-week
-
Percent change in contract volume week-over-week, broken down by home price:
- $0-$200k: (-6.9%)
- $200k-$400k: (-7.1%)
- $400k-$600k: (-8.0%)
- $600k-$1mm: (-9.2%)
- >$1mm: (-10.6%)
-
The total volume of listings going into contract since the week ending March 13 versus the same period in 2019, broken down by home price:
- $0-$200k: (-12.4%)
- $200k-$400k: +4.5%
- $400k-$600k: +16.7%
- $600k-$1mm: +21.9%
- >$1mm: +23.1%
Total Listings Under Contract:
- Since the week ending March 13, 2,083,214 properties have gone into contract across 41 states, representing a 3.9% increase relative to the same period in 2019
- For the week ending October 9, there were 66,297 listings that went under contract nationwide
-
Percentage of total contract volume since the week ending March 13, broken down by home price:
- $0-$200k: 23.4%
- $200k-$400k: 44.8%
- $400k-$600k: 17.5%
- $600k-$1mm: 9.8%
- >$1mm: 4.5%
Median Listing Price Activity (Single-Family Detached Homes):
-
38 states are experiencing higher median prices of closed listings since the onset of the pandemic, with 18 states continuing to climb week-over-week
-
The states with the most significant closed listing price increases since the pandemic’s onset include:
- New York: +28.0%
- New Jersey: +27.4%
- Vermont: +27.0%
- Connecticut: +27.0%
- The most significant week-over-week closed listing price increase was in New York, with prices rising 5.5%
-
The states with the most significant closed listing price increases since the pandemic’s onset include:
As a nationwide real estate broker, HouseCanary’s broad multiple listing service (“MLS”) participation allows us to evaluate listing data and aggregate the number of new listings as well as the number of new listings going into contract for all single-family detached homes observed in the HouseCanary database. Using this data, HouseCanary continues to track listing volume, new listings, and median list price for 41 states and 50 individual Metropolitan Statistical Areas (“MSAs”).
About HouseCanary:
Founded in 2013, valuation-focused real estate brokerage HouseCanary provides software and services to reshape the real estate marketplace. Financial institutions, investors, lenders, mortgage investors, and consumers turn to HouseCanary for industry-leading valuations, forecasts, and transaction-support tools. These clients trust HouseCanary to fuel acquisition, underwriting, portfolio management, and more. Learn more at www.housecanary.com.
