ARLINGTON, Va.--(BUSINESS WIRE)--E*TRADE Financial Corporation (NASDAQ: ETFC) today announced results from the most recent wave of StreetWise, the E*TRADE quarterly tracking study of experienced investors. Results show trading trends among Gen Z and Millennial investors during the COVID-19 crisis:
- Risk tolerance skyrockets since the pandemic. Over half (51%) of Gen Z and Millennial investors say their risk tolerance has increased since the coronavirus outbreak, 23 percentage points higher than the total population.
- They are taking cash off the sidelines. Over one in three investors (34%) under the age of 34 said they are moving out of cash and into new positions, 15 percentage points higher than the total population.
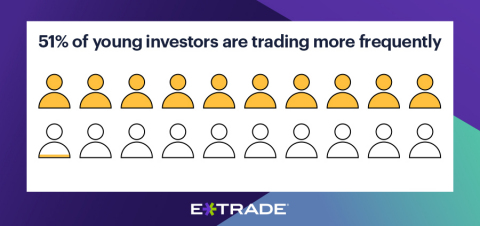
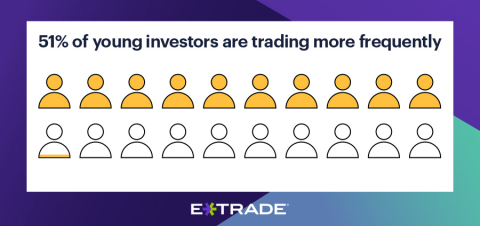
- And they are trading more frequently. Over half of investors (51%) under the age of 34 said they are trading equities and 46% said they’re trading derivatives more frequently since the pandemic, compared to 30% and 22% of the total population, respectively.
- They’re optimistic for a quick recovery. While only 9% of young investors said their investment portfolios have recovered since the beginning of the pandemic, 50% think it will happen in the next six months, compared to 33% of the total population.
- Health concerns come first, but portfolio concerns are a close second. Personal health (58%) and investment portfolio (53%) concerns remain the top worries for young investors in the wake of the pandemic.
“When it comes to Millennials and Gen Z investors, time is on their side, but that doesn’t mean they can be complacent or act emotionally,” said Chris Larkin, Managing Director of Trading and Investment Product at E*TRADE Financial. “Access to the market has never been easier, so investors just embarking on trading should walk before they run. A thoughtful and disciplined approach is key—do your research, set up watch lists, and align your trading strategy with your goals and risk tolerance.”
Mr. Larkin offered additional guidance to young investors getting started with trading:
- Do your homework—don’t get caught up in stock fads. Like any purchase, impulse buying is never the way to go. Look at both the fundamental and technical indicators of a stock before diving in. Investors may use fundamental analysis to narrow down the choice of stocks and compare companies side by side, while technical analysis may come into play as they enter and exit positions and manage risk.
- Learn the full spectrum of options trading. While young investors may gravitate to options to speculate on the future price of a stock in either direction, the reality is these derivatives are also used to leverage, hedge, and generate income. Leverage allows a trader to use less money to gain exposure to the movement of a stock’s price, while hedging is about reducing risk. Options can help protect trades—or an overall portfolio—in case things don’t work out quite as planned. Lastly, one of the biggest reasons investors trade options is to produce income—some options strategies let an investor collect money on existing or future stock positions. Of course, investors of all ages should understand that the existing stock may have to be sold for less than the current market price. Options trading is not appropriate for everyone and there are risks associated—as with any investment vehicle. Know your long-term goals and risk tolerance before getting started.
- Test drive trading ideas. Many firms offer paper trading that allows traders across experience levels to test drive any investing idea—from simple equity trades to complex options strategies—without committing actual capital. Monitor a paper trading portfolio and easily modify to analyze new scenarios after executing a trade.
E*TRADE aims to enhance the financial independence of traders and investors through a powerful digital offering and professional guidance. To learn more about E*TRADE’s trading and investing platforms and tools, visit etrade.com.
For useful trading and investing insights from E*TRADE, follow the company on Twitter, @ETRADE.
About the Survey
This wave of the survey was conducted from July 1 to July 9 of 2020 among an online US sample of 873 self-directed active investors who manage at least $10,000 in an online brokerage account. The survey has a margin of error of ±3.20 percent at the 95 percent confidence level. It was fielded and administered by Dynata. The panel is broken into thirds of active (trade more than once a week), swing (trade less than once a week but more than once a month), and passive (trade less than once a month). The panel is 60% male and 40% female, with an even distribution across online brokerages, geographic regions, and age bands.
About E*TRADE Financial and Important Notices
E*TRADE Financial and its subsidiaries provide financial services including brokerage and banking products and services to retail customers. Securities products and services, including options, are offered by E*TRADE Securities LLC (Member FINRA/SIPC). Commodity futures and options on futures products and services are offered by E*TRADE Futures LLC (Member NFA). Managed Account Solutions are offered through E*TRADE Capital Management, LLC, a Registered Investment Adviser. Bank products and services are offered by E*TRADE Bank, and RIA custody solutions are offered by E*TRADE Savings Bank, both of which are national federal savings banks (Members FDIC). More information is available at www.etrade.com.
Options transactions are intended for sophisticated investors and are complex, carry a high degree of risk, and are not suitable for all investors. For more information, please read the Characteristics and Risks of Standardized Options prior to applying for an account.
The information provided herein is for general informational purposes only and should not be considered investment advice. Past performance does not guarantee future results.
E*TRADE Financial, E*TRADE, and the E*TRADE logo are trademarks or registered trademarks of E*TRADE Financial Corporation. ETFC-G
© 2020 E*TRADE Financial Corporation. All rights reserved.
E*TRADE Financial Corporation engages Dynata to program, field, and tabulate the study. Dynata provides digital research data and has locations in the Americas, Europe, the Middle East and Asia-Pacific. For more information, please go to www.dynata.com.
Referenced Data |
|||||||
My risk tolerance has ________since the Coronavirus outbreak. |
|||||||
|
Total |
<34 |
|||||
Top 2 Box |
28% |
51% |
|||||
Greatly increased |
8% |
20% |
|||||
Somewhat increased |
20% |
31% |
|||||
Stayed the same |
45% |
31% |
|||||
Somewhat decreased |
22% |
14% |
|||||
Greatly decreased |
5% |
4% |
|||||
Bottom 2 Box |
27% |
18% |
|||||
When it comes to your portfolio for the next six months are you considering any of the following strategies? |
|||||||
|
Total |
<34 |
|||||
Move out of current positions and into cash |
14% |
24% |
|||||
Move out of cash and into new positions |
19% |
34% |
|||||
Change the allocations in my portfolio |
23% |
25% |
|||||
Make no changes to my portfolio |
42% |
17% |
|||||
Amid the COVID-19 pandemic, would you say you are trading equities… |
|||||||
|
Total |
<34 |
|||||
Top 2 Box |
30% |
51% |
|||||
Much more frequently |
8% |
19% |
|||||
Somewhat more frequently |
22% |
32% |
|||||
About the same |
56% |
37% |
|||||
Somewhat less frequently |
10% |
9% |
|||||
Much less frequently |
5% |
3% |
|||||
Bottom 2 Box |
14% |
12% |
|||||
Amid the COVID-19 pandemic, would you say you are trading derivatives, (i.e., options and futures)… |
|||||||
|
Total |
<34 |
|||||
Top 2 Box |
22% |
46% |
|||||
Much more frequently |
7% |
19% |
|||||
Somewhat more frequently |
15% |
27% |
|||||
About the same |
63% |
41% |
|||||
Somewhat less frequently |
5% |
8% |
|||||
Much less frequently |
10% |
5% |
|||||
Bottom 2 Box |
15% |
13% |
|||||
How long do you anticipate it will take your investment portfolio to recover from the hit taken during the COVID–19 pandemic? |
|||||||
|
Total |
<34 |
|||||
It has already recovered |
15% |
9% |
|||||
1-3 months |
10% |
19% |
|||||
4-6 months |
23% |
31% |
|||||
7-12 months |
24% |
25% |
|||||
1-5 years |
25% |
13% |
|||||
5+ years |
3% |
3% |
|||||
When it comes to the Coronavirus, which are you most concerned about? Please select your top two choices. |
|||||||
|
Total Q/Q |
Age <34 |
|||||
|
Q3’20 |
Q2’20 |
Q3’20 |
Q2’20 |
|||
My own personal health, and the health of my family and friends |
65% |
68% |
58% |
58% |
|||
My investment portfolio (e.g., self-directed brokerage account, retirement account, managed account) |
43% |
47% |
53% |
49% |
|||
My job and potential job prospects |
25% |
18% |
42% |
27% |
|||
The effect on the US and global economies |
46% |
34% |
37% |
16% |
|||
My ability to afford day-to-day living expenses (e.g., groceries, rent, utilities, childcare) |
18% |
17% |
34% |
33% |
|||
My personal vacation and leisure plans |
30% |
14% |
28% |
15% |
|||
Reopening local economies too quickly |
31% |
-- |
26% |
-- |
|||
Possibility of a second wave |
40% |
-- |
21% |
-- |
|||
Gen Z and Millennials (young investors) are defined as age 18–34 years old


