CAMBRIDGE, Mass.--(BUSINESS WIRE)--As Congress and the White House continue to discuss potential changes to the Affordable Care Act (ACA), PatientsLikeMe revealed results from the first large-scale poll to assess patient priorities for the health care law. The poll’s 2,197 respondents are among the estimated 133 million Americans living with chronic conditions.
Sally Okun, PatientsLikeMe’s Vice President of Advocacy, Policy and Patient Safety, said the poll gives voice to those who may be most heavily impacted by changes to the law. “Regardless of your political leaning, the great equalizer is that we’ll all become sick one day. At this time of uncertainty about the future of health care, listening to the voice of patients today will illuminate the path forward for all of us.”
Key findings from the poll show that overall, patients have the same concerns as the general population about health care costs, but see benefits in the law that the healthy may have overlooked:
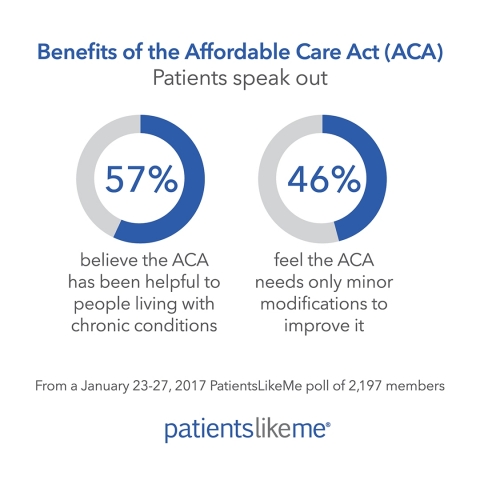
- More than half (57%) believe the ACA has been helpful to people living with chronic conditions.
- Nearly half (46%) feel the ACA needs only minor modifications to improve it.
- Over the last year, their out-of-pocket expenses for health care have either stayed the same (47%) or increased (43%).
- Lowering costs is a priority for both patients in the PatientsLikeMe poll and for the general population, which took part in a December 2016 Kaiser Health Tracking Poll. Lowering the amount individuals pay for health care is an important priority for 94% of patients and 93% of the general population. Lowering the cost of prescription drugs is an important priority for 96% of patients and 89% of the general population.
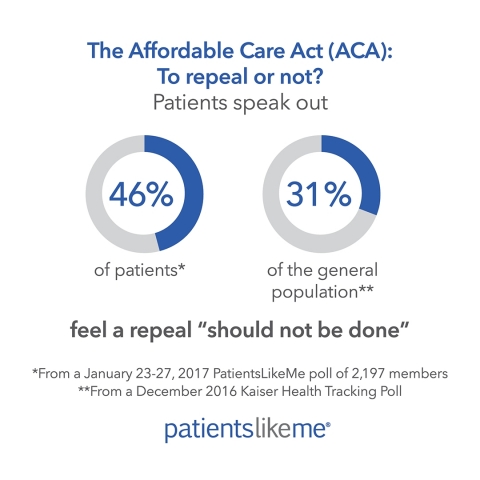
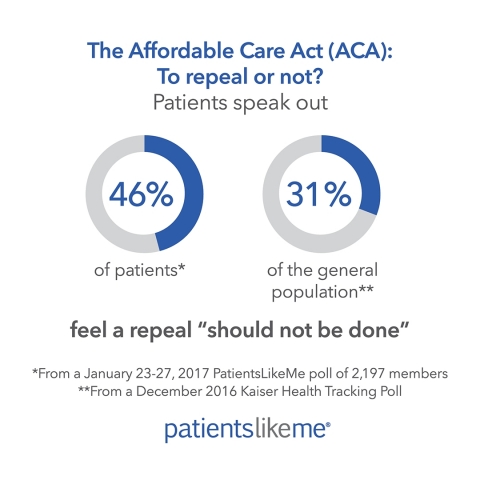
- Nearly half (46%) of PatientsLikeMe poll respondents felt that a repeal of the 2010 ACA “should not be done,” while one third (31%) of the Kaiser general population felt it “should not be done.”
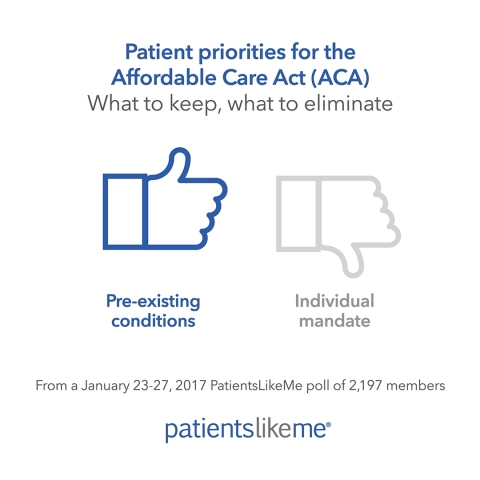
- When asked which one component of the ACA they would eliminate if they were forced to choose, PatientsLikeMe respondents were four times more likely to say they would eliminate the individual mandate vs. other components of the ACA.
- When asked which one component of the ACA they would keep if they were forced to choose, PatientsLikeMe respondents were six times more likely to say they would keep mandatory coverage for pre-existing conditions vs. other components of the ACA.
-
The widest differences in opinion related to questions about a repeal
of and government involvement in health care law, and were found
between the general population, non-condition specific patients, and
those who reported major depressive disorder (MDD) as their primary
condition:
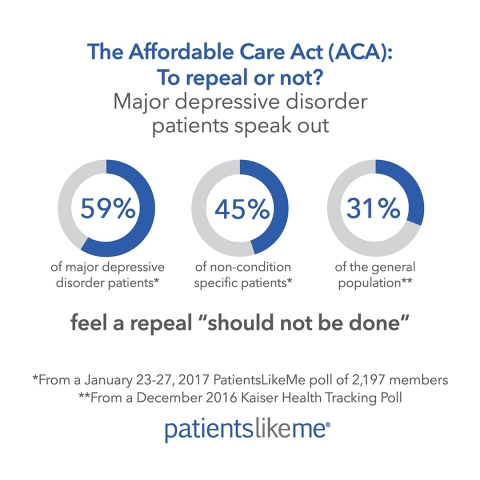
- Of those living with MDD, 59% said that the health care law should not be repealed, vs. 45% of the overall PatientsLikeMe respondents and 31% of the Kaiser general population.
- 42% of respondents living with MDD said decreasing federal government spending on health care should not be done, vs. 29% of the overall patient population and 18% of the Kaiser general population.
- As for reducing the federal government’s role in health care, 37% of patients living with MDD said it should not be done, compared to 28% of the overall patient population and 20% of the Kaiser general population.
Okun said that patients living with MDD may have a stronger opinion about healthcare law given the Paul Wellstone and Pete Domenici Mental Health Parity and Addiction Equity Act (MHPAEA), a law passed by Congress in 2008 and codified into rules in 2013 to ensure equal treatment coverage for mental illness and addiction. According to the National Alliance on Mental Illness (NAMI), before the law, “mental health treatment was typically covered at far lower levels in health insurance policies than physical illness.”
Full survey results and graphics are available at http://news.patientslikeme.com.
PatientsLikeMe Poll Methodology
Between January 23-27, 2017, PatientsLikeMe fielded a 19-question poll to a sample of its members in the United States who are living with chronic or progressive degenerative conditions. A total of 2,197 patients completed the poll, which asked both original questions and questions from a December 2016 Kaiser Health Tracking Poll to compare patient and general population responses.
Respondents had a range of chronic or progressive medical conditions and listed their primary condition as multiple sclerosis (13%), fibromyalgia (12%), Parkinson’s disease (6%), major depressive disorder (5%), ALS (5%), type 2 diabetes (3%) and multiple myeloma (3%), among many other conditions. The mean age of respondents was 54.5 years (the range was 18- >89). Of 1,840 respondents who gave information on level of education (83.8% of total), 1.0% had less than a high school diploma, 11.0% had high school diplomas, 38.3% had some college, 27.7% reported a college degree, and 22% reported post-graduate education. About one-third (36%) of patients had health insurance through their employer, one-third (35%) had Medicare; and the rest had a mix of other health care coverage including Medicaid, VA, military, and direct pay insurance, which includes insurance purchased from ACA exchange programs. A very small percentage (2.5%) of respondents said they had no health insurance. Nearly all respondents (95%) are registered voters. Their party affiliation is as follows: 37% say they are Democrats, 19% are Republicans; 15% are Independent; 13% preferred not to say; 11% are unaffiliated and 4% are Libertarian.
About PatientsLikeMe
PatientsLikeMe, the world’s largest personalized health network, helps people find new options for treatments, connect with others, and take action to improve their outcomes. The company has worked with every major pharmaceutical company and a range of government organizations to bring the patient voice to research, development and public policy. With 500,000 members, PatientsLikeMe is a trusted source for real-world disease information and a clinically robust resource that has published more than 100 research studies. Visit us at www.patientslikeme.com or follow us via our blog, Twitter or Facebook.
PatientsLikeMe Poll Questions and Responses (18 multiple choice; 1 open ended)
As you answer the next few questions, reflect back on 2016 and let us know how your experiences changed.
The quality of my health care … (n=2197)
| Improved | 336 (15.3%) | |||
| Stayed the same | 1404 (63.9%) | |||
| Got worse | 457 (20.8%) |
My out-of-pocket health care costs … (n=2197)
| Decreased | 220 (10.0%) | |||
| Stayed the same | 1034 (47.1%) | |||
| Increased | 943 (42.9%) |
My health itself … (n=2197)
| Improved | 289 (13.2%) | ||||
| Stayed the same | 1032 (47.0%) | ||||
| Got worse | 876 (40.0%) |
How much of a priority for you is lowering the amount individuals pay for health care? (n=2197)
| Top priority | 1184 (54.0%) | |||
| Important but not a top priority | 869 (40.0%) | |||
| Not too important | 112 (5.1%) | |||
| Should not be done | 32 (1.5%) |
How much of a priority for you is lowering the cost of prescription drugs? (n=2197)
| Top priority | 1440 (65.5%) | |||
| Important but not a top priority | 676 (30.8%) | |||
| Not too important | 68 (3.1%) | |||
| Should not be done | 13 (0.6%) |
How much of a priority for you is dealing with the prescription painkiller addiction epidemic? (n=2197)
| Top priority | 573 (26.1%) | |||
| Important but not a top priority | 1086 (49.4%) | |||
| Not too important | 473 (21.5%) | |||
| Should not be done | 65 (3.0%) |
How much of a priority for you is repealing the 2010 health care law (called the Affordable Care Act, or ACA, or Obamacare)? (n=2197)
| Top priority | 570 (25.9%) | |||
| Important but not a top priority | 401 (18.3%) | |||
| Not too important | 217 (9.9%) | |||
| Should not be done | 1009 (45.9%) |
How much of a priority for you is decreasing how much the federal government spends on health care over time? (n=2197)
| Top priority | 410 (18.7%) | |||
| Important but not a top priority | 800 (36.4%) | |||
| Not too important | 337 (15.3%) | |||
| Should not be done | 650 (29.6%) |
How much of a priority for you is decreasing the role of the federal government in health care? (n=2197)
| Top priority | 531 (24.2%) | |||
| Important but not a top priority | 669 (30.5%) | |||
| Not too important | 341 (15.5%) | |||
| Should not be done | 656 (29.9%) |
How do you think a complete repeal of the Affordable Care Act (also called ACA, or Obamacare) might affect you?
| Positively | 285 (13.0%) | |||
| Negatively | 845 (38.5%) | |||
| I don’t know | 620 (28.2%) | |||
| I don’t expect changes to affect me | 447 (20.3%) |
When it comes to your opinion about the health care law (the Affordable Care Act, also called ACA, or Obamacare), do you feel that it (choose the one statement you agree with the most)… (n=2197)
| Is working well the way it is | 138 (6.3%) | |||
| Needs minor modifications to | 1003 (45.7%) | |||
| improve it | ||||
|
Needs a major overhaul |
621 (28.3%) |
|||
| Should be totally eliminated | 285 (13.0%) | |||
| Other | 36 (1.6%) | |||
| Not sure | 114 (5.2%) |
Have you or your family been helped by any part of the health care law (the Affordable Care Act, also called ACA, or Obamacare) that was passed by Congress and signed into law in 2010? (n=2197)
| Yes | 911 (41.5%) | |||
| No | 785 (35.7%) | |||
| The health care law has hurt me | 277 (12.6%) | |||
| or a member of my family | ||||
| Not sure | 224 (10.2%) |
If you were forced to choose, which ONE of the following would you want lawmakers to eliminate from the Affordable Care Act (ACA or Obamacare)? (n=2197)
| The “individual mandate” which requires | 1007 (45.8%) | |||
| most non-exempt Americans to maintain | ||||
| minimum essential coverage, or pay a fee | ||||
| on their year-end taxes if they go | ||||
| without coverage | ||||
|
The “employer mandate” requiring that |
253 (11.5%) |
|||
| all businesses with 50 or more full-time |
|
|||
| equivalent employees (FTEs) provide | ||||
| health insurance to at least 95% of their | ||||
| full-time employees and dependents up | ||||
| to age 26, or pay a fee | ||||
| Subsidies for small businesses to help | 138 (6.3%) | |||
| them cover the costs of providing health | ||||
| insurance coverage to employees | ||||
| Mandatory coverage for pre-existing | 188 (8.6%) | |||
| conditions | ||||
| No annual coverage limits | 152 (6.9%) | |||
| Medicaid expansion for low-income | 120 (5.5%) | |||
| Americans | ||||
| Cost assistance for people who make | 147 (6.7%) | |||
| $46,000 or less (individuals) or $93,500 | ||||
| or less (families) | ||||
| Essential health benefits and preventative | 192 (8.7%) | |||
| services at no out-of-pocket costs |
If you were forced to choose, which ONE of the following would you want lawmakers to keep in the Affordable Care Act (ACA or Obamacare)? (n=2197)
| The “individual mandate” which requires | 148 (6.7%) | |||
| most non-exempt Americans to maintain | ||||
| minimum essential coverage, or pay a fee | ||||
| on their year-end taxes if they go | ||||
| without coverage | ||||
| The “employer mandate” requiring that | 128 (5.8%) | |||
| all businesses with 50 or more full-time | ||||
| equivalent employees (FTEs) provide | ||||
| health insurance to at least 95% of their | ||||
| full-time employees and dependents up | ||||
| to age 26, or pay a fee | ||||
| Subsidies for small businesses to help | 126 (5.7%) | |||
| them cover the costs of providing health | ||||
| insurance coverage to employees | ||||
| Mandatory coverage for pre-existing | 1202 (54.7%) | |||
| Conditions | ||||
| No annual coverage limits | 99 (4.5%) | |||
| Medicaid expansion for low-income | 175 (8.0%) | |||
| Americans | ||||
| Cost assistance for people who make | 139 (6.3%) | |||
| $46,000 or less (individuals) or $93,500 | ||||
| or less (families) | ||||
| Essential health benefits and preventative | 180 (8.2%) | |||
| services at no out-of-pocket costs |
How successful do you think the Affordable Care Act (or ACA, or Obamacare) has been in helping people who are living with chronic conditions? (n=2197)
| Very helpful | 820 (37.3%) | |||
| Somewhat helpful | 425 (19.3%) | |||
| Not sure | 581 (26.4%) | |||
| Not helpful | 196 (8.9%) | |||
| Not at all helpful | 175 (8.0%) |
Can you share more about your experience? (open ended; responses collected)
What type of health insurance do you have? (n=2197)
| Private (through employer or union) | 791 (36.0%) | |||
| Private (individual plan) | 168 (7.6%) | |||
| Medicare | 759 (34.5%) | |||
| Medicaid/other low-income | 255 (11.6%) | |||
| government plan | ||||
| Veteran's Administration | 78 (3.6%) | |||
| TRICARE/other military health | 44 (2.0%) | |||
| insurance | ||||
| Indian Health Service | 3 (0.1%) | |||
| Other type of insurance | 45 (2.0%) | |||
| No Insurance | 54 (2.5%) |
Are you currently registered to vote? (n=2197)
| Registered | 2096 (95.4%) | |||
| Not registered | 86 (3.9%) | |||
| Not sure | 15 (0.7%) |
What is your party affiliation? (n=2197)
| Democrat | 812 (37.0%) | |||
| Green Party | 15 (0.7%) | |||
| Independent | 337 (15.3%) | |||
| Libertarian | 93 (4.2%) | |||
| Republican | 419 (19.0%) | |||
| Unaffiliated | 232 (10.6%) | |||
| I prefer not to say | 289 (13.2%) |

