Newsroom
Sorted by: Latest
-
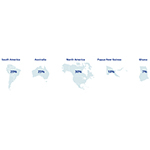
Newmont 公佈 2025 年礦產儲量:黃金 1.182 億盎司、銅 1,250 萬公噸
丹佛--(BUSINESS WIRE)--(美國商業資訊)-- Newmont Corporation(紐約證券交易所代號:NEM,澳洲證券交易所代號:NGT,巴布亞紐幾內亞證券交易所代號:NEM)(「Newmont」或「本公司」)公佈,截至 2025 年底,其應佔黃金礦產儲量(「儲量」)為 1.182 億盎司,低於 2024 年底的 1.341 億盎司,主要原因是 2025 年的資產剝離。Newmont 的資產組合同時包括其他重要金屬儲量,包括應佔銅儲量 1,250 萬公噸及應佔白銀儲量 4.42 億盎司。 「 2025 年,Newmont 繼續保持業界最大黃金儲量基礎的地位,公佈儲量達 1.18 億盎司,代表數十年的生產年限及可觀的增長潛力。」Newmont 總裁兼首席執行官 Natascha Viljoen 表示,「 透過在領先的勘探計劃中嚴格應用技術規範,我們將持續專注於延長礦山壽命、發現新機會,並在我們世界級的營運與項目組合中釋放價值。」 2025 年儲量與資源亮點 擁有全球黃金業界最大儲量基礎,達 1.182 億應佔盎司1 自 2024 年以來的變化主要源於資產剝離(860...
-
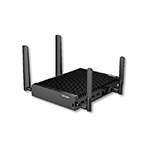
レノボ、次世代AI駆動ThinkEdgeソリューションでデータ活用の可能性を拡大
ノースカロライナ州モリスビル--(BUSINESS WIRE)--(ビジネスワイヤ) -- レノボ™は、コンパクトで信頼性の高いThinkEdge SE10n Gen 2、AI対応のThinkEdge SE30n Gen 2、高いAI性能を備えたThinkEdge SE60n Gen 2、そしてレノボ初の産業用オールインワン(AIO)Panel PC「ThinkEdge SE50a」を含む、新世代のAI駆動型エッジコンピューティングソリューションを投入し、ThinkEdge製品群を拡張しました。 企業がレジリエンスの向上、レイテンシーの削減、機密データのローカル管理を目的に、業務オペレーションの現場に近い場所へインテリジェンスを配置する動きを進める中、エッジコンピューティングはデバイス、インフラ、クラウドをつなぐ中核的なレイヤーになっています。レノボのThinkEdgeソリューションは、従来のサーバーやPCでは対応が難しい過酷かつ省スペース環境で信頼性高く稼働するように設計された、用途特化の産業グレードエッジシステムです。 拡張可能なAIオプションを備えたIntel Coreプロセッ...
-
Resolute Dermatology, LLC Joins Epiphany Dermatology
AUSTIN, Texas--(BUSINESS WIRE)--Epiphany Dermatology announced today it has expanded its presence in Kansas through its partnership with Resolute Dermatology, LLC....

-
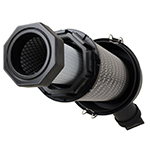
Donaldson推出ArmorSeal™:開創公路及非公路重型設備空氣過濾技術的新紀元
明尼阿波利斯--(BUSINESS WIRE)--(美國商業資訊)-- 全球領先的技術型過濾產品及解決方案供應商Donaldson Company, Inc. (NYSE: DCI) 今天宣布推出其新一代空氣過濾技術——ArmorSeal™。 ArmorSeal技術凝聚了Donaldson數十年來在空氣過濾領域的先進經驗,從Axial Seal到業界標竿RadialSeal™,再到如今專為滿足當下最嚴苛運作環境而設計的全新標準。 隨著非公路、工程機械和重型設備在高振動、高粉塵負荷和更頻繁的維護保養週期下持續運行,保持密封件的長期完整性已成為業界面臨的最嚴峻挑戰之一。ArmorSeal技術正是為了因應這項挑戰而生,在可靠性、耐用性和維護一致性方面實現了質的飛躍。 ArmorSeal技術採用精密旋轉焊接接頭,透過均勻可重複的旋轉焊接工藝取代傳統卡扣和黏合劑,結合基於幾何結構的工程化密封介面,有效消除常見故障模式。此設計可長期保持可控的密封壓力,同時降低服務人力投入和安裝差異。 「非計劃性停機仍然是設備所有者最大的成本驅動因素之一,而有效的空氣過濾在減少停機方 面發揮著至關重要的作用,」空氣...

-
Sammons Financial Group Continues Strong Charitable Giving, Volunteerism in 2025
WEST DES MOINES, Iowa--(BUSINESS WIRE)--Throughout 2025, Sammons® Financial Group, Inc. continued its commitment to supporting local communities, donating nearly $4.6 million to charitable organizations across its corporate locations. In addition, employees contributed more than 11,000 volunteer hours, reflecting the company’s ongoing dedication to service and community impact. “Giving back remains a core part of who we are as an employee-owned company,” said Rob TeKolste, President, Sammons Fi...
-
EHAB Stock Alert: Halper Sadeh LLC is Investigating Whether Enhabit, Inc. is Obtaining a Fair Price for its Shareholders
NEW YORK--(BUSINESS WIRE)--Halper Sadeh LLC, an investor rights law firm, is investigating the sale of Enhabit, Inc. (NYSE: EHAB) to Kinderhook Industries, LLC for $13.80 per share in cash. Halper Sadeh encourages Enhabit shareholders to click here to learn more about their rights and options or contact Daniel Sadeh or Zachary Halper free of charge at (212) 763-0060 or sadeh@halpersadeh.com or zhalper@halpersadeh.com. The investigation concerns whether Enhabit and its board of directors violate...
-
Donaldson推出ArmorSeal™:开创公路及非公路重型设备空气过滤技术的新纪元
明尼阿波利斯--(BUSINESS WIRE)--(美国商业资讯)-- 全球领先的技术型过滤产品及解决方案供应商Donaldson Company, Inc. (NYSE: DCI) 今日宣布推出其新一代空气过滤技术——ArmorSeal™。ArmorSeal技术凝聚了Donaldson数十年来在空气过滤领域的先进经验,从Axial Seal到行业标杆RadialSeal™,再到如今专为满足当下最严苛运行环境而设计的全新标准。 随着非公路、工程机械和重型设备在高振动、高粉尘负荷和更频繁的维护保养周期下持续运行,保持密封件的长期完整性已成为行业面临的最严峻挑战之一。ArmorSeal技术正是为了应对这一挑战而生,在可靠性、耐用性和维护一致性方面实现了质的飞跃。 ArmorSeal技术采用精密旋转焊接接头,通过均匀可重复的旋转焊接工艺取代传统卡扣和粘合剂,结合基于几何结构的工程化密封界面,有效消除常见故障模式。这种设计可长期保持可控的密封压力,同时降低服务人力投入和安装差异。 “计划外停机仍然是设备所有者最大的成本驱动因素之一,而有效的空气过滤在减少停机方面发挥着至关重要的作用,”空气产品...
-
ADDING MULTIMEDIA Aalyria Raises $100 Million to Build the Next-Generation Communications Backbone of the New Space Age
LIVERMORE, Calif.--(BUSINESS WIRE)--Aalyria, an advanced aerospace communications company whose products are critical to the next generation of space-based communications systems, today announced the closing of its $100 million Series B financing, valuing the company at $1.3 billion. The round was led by Battery Ventures and J2 Ventures, with participation from DYNE and other investors. The new funding will accelerate Aalyria’s mission to make resilient, high-throughput networks in motion pract...
-
Sirion gibt den Abschluss einer Mehrheitsbeteiligung von Haveli bekannt, um die Zukunft des KI-basierten Lebenszyklusmanagements für Verträge voranzutreiben
AUSTIN, Texas--(BUSINESS WIRE)--Sirion, ein weltweit führender Anbieter von KI-basierter Software für das Vertragslebenszyklusmanagement (Contract Lifecycle Management, CLM), gab heute den Abschluss einer Mehrheitsbeteiligung durch Haveli Investments, LP („Haveli” oder „Haveli Investments”), eine auf Technologie spezialisierte Investmentgesellschaft mit Sitz in Austin, bekannt. Die Transaktion wurde bereits im Januar angekündigt. Die Investition markiert eine neue Phase im Wachstum von Sirion,...
-
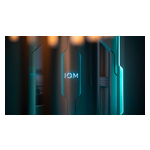
Samenvatting: IQM, een wereldleider in kwantumcomputing, wordt het eerste beursgenoteerde Europese kwantumbedrijf door fusie met Real Asset Acquisition Corp.
PRINCETON, N.J. & ESPOO, Finland--(BUSINESS WIRE)--IQM Finland Oy, een wereldleider in complete supergeleidende kwantumcomputers ('IQM', 'IQM Quantum Computers' of het 'bedrijf'), en Real Asset Acquisition Corp. (Nasdaq: RAAQ), een Special Purpose Acquisition Company ('RAAQ'), hebben vandaag aangekondigd dat ze een definitieve overeenkomst voor een bedrijfscombinatie hebben gesloten. Deze fusie zal ertoe leiden dat IQM een beursgenoteerd bedrijf wordt en American Depositary Shares (ADS) noteert...