Newsroom
Sorted by: Latest
-
USA Compression Partners LP Announces Filing of 2025 Annual Report on Form 10-K
DALLAS--(BUSINESS WIRE)--USA Compression Partners, LP (NYSE: USAC) (“USA Compression”) today announced that it filed its Annual Report on Form 10-K for the fiscal year ended December 31, 2025, with the U.S. Securities and Exchange Commission (“SEC”). USA Compression’s Annual Report on Form 10-K is available through its website at www.usacompression.com in the Investor Relations section under Financials-SEC Filings, as well as on the SEC’s website at sec.gov. Interested investors may obtain a ha...
-
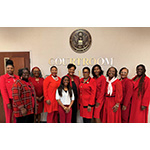
Legal Defense Fund Begins Trial to Strike Down Racially Discriminatory Voting Maps in DeSoto County, Mississippi
WASHINGTON--(BUSINESS WIRE)--Trial began today in Harris v. DeSoto County in federal court in the Northern District of Mississippi, where Legal Defense Fund (LDF) is challenging a racially discriminatory electoral map in DeSoto County. LDF, along with the Election Law Clinic at Harvard Law School, the ACLU of Mississippi, and voting rights attorney Amir Badat, filed the lawsuit in September 2024. The groups represent Delta Sigma Theta Sorority, Inc., DeSoto County NAACP and two individual DeSot...
-
Camden Property Trust Prices $600 Million 4.900% Senior Unsecured Notes Due 2036
HOUSTON--(BUSINESS WIRE)--Camden Property Trust (NYSE:CPT) today announced it has priced a $600 million offering of senior unsecured notes under its existing shelf registration. These 10-year notes were issued at 99.936% of par value with a coupon of 4.900%. Interest on the notes is payable semi-annually on February 28 and August 28, with the first payment becoming due and payable on August 28, 2026, and the notes will mature on February 28, 2036. Camden expects to use the net proceeds of appro...
-
Rose Hunter Jones Earns Repeat eDiscovery Honors from Chambers Global
ATLANTA--(BUSINESS WIRE)--Hilgers PLLC partner Rose Hunter Jones, a recognized authority in eDiscovery and legal technology, has been ranked again among the industry’s leaders in eDiscovery and information governance by the authoritative analysis firm Chambers Global. Ms. Jones consults with global business leaders on data privacy and security, advises clients on issues related to government investigations and plays a leading role in high-risk litigation on behalf of pharmaceutical and commerci...

-
Merchants & Marine Bancorp, Inc. Announces 2025 Financial Results
PASCAGOULA, Miss.--(BUSINESS WIRE)--Merchants & Marine Bancorp Announces Earnings...
-
Buenaventura Announces Fourth Quarter 2025 Results for Production and Volume Sold per Metal
LIMA, Peru--(BUSINESS WIRE)--Compañía de Minas Buenaventura S.A.A. (“Buenaventura” or “the Company”) (NYSE: BVN; Lima Stock Exchange: BUE.LM), Peru’s largest publicly-traded precious metals mining company, today announced 4Q25 results for production and volume sold. Production per Metal Three Months Ended December 31, 2025 Year Ended December 31, 2025 Year Ended December 31, 2026 Guidance (1) Gold ounces produced El Brocal 61.43% 5,862 21,102 15.0k - 17.0k Orcopampa 100% 15,754...
-
BlackRock Investor News: Rosen Law Firm Announces Investigation of Breaches of Fiduciary Duties by the Directors and Officers of BlackRock, Inc. – BLK
NEW YORK--(BUSINESS WIRE)--Rosen Law Firm, a global investor rights law firm, announces an investigation of potential breaches of fiduciary duties by the directors and officers of BlackRock, Inc. (NYSE: BLK). If you currently own shares of BlackRock stock, please visit the firm’s website at https://rosenlegal.com/submit-form/?case_id=53546 for more information. You may also contact Phillip Kim of Rosen Law Firm toll free at 866-767-3653 or via email at case@rosenlegal.com. Why Rosen Law: We enc...
-
Airgain® Reports Granting of Inducement Awards Under Nasdaq Listing Rule 5635(c)(4)
SAN DIEGO--(BUSINESS WIRE)--Airgain, Inc. (NASDAQ: AIRG), a leading provider of advanced wireless connectivity solutions, today announced that it has granted inducement awards to new employees who recently joined the Company. The awards were granted on February 15, 2026, under Airgain’s 2021 Employment Inducement Incentive Award Plan, which provides for the granting of equity awards to new employees of Airgain as an inducement to join the company. The inducement awards to the new employees cons...
-
Bernstein Litowitz Berger & Grossmann Announces Filing of Racketeering Class Action Against Express Scripts
NEW YORK--(BUSINESS WIRE)--Today, Bernstein Litowitz Berger & Grossmann LLP (BLB&G) announces the filing of a class action against Express Scripts – the nation’s largest Pharmacy Benefits Manager (PBM) – and its parent companies, Cigna and Evernorth. BLB&G filed this action on behalf of the Plumbers’ Welfare Fund, which provides healthcare benefits for members of Chicago-based Plumbers Local 130. Local 130 has long been a leader in advocating for labor rights and expanding healthcar...
-
GE Vernova Declares Second Quarter 2026 Dividend
CAMBRIDGE, Mass.--(BUSINESS WIRE)--GE Vernova (NYSE: GEV) today announced that its Board of Directors has declared a $0.50 per share quarterly dividend. The quarterly dividend will be payable on April 14, 2026, to shareholders of record as of March 17, 2026. Future dividend declarations will be made at the discretion of the Board of Directors and will be based on GE Vernova’s earnings, financial condition, cash requirements, prospects, and other factors. Additional Information GE Vernova’s webs...