Newsroom
Sorted by: Latest
-
First Trust Global Funds PLC UK Regulatory Announcement: Net Asset Value(s)
LONDON--(BUSINESS WIRE)-- Funds Date TIDM ISIN Code Shares in Issue Currency Net Asset Value NAV/per Share First Trust Vest U.S. Equity Max Buffer UCITS ETF- June 13.02.2026 MJUN LN IE000CO3P697 150,002.00 USD 3,729,611.08 24.864 ...
-
First Trust Global Funds PLC UK Regulatory Announcement: Net Asset Value(s)
LONDON--(BUSINESS WIRE)-- Funds Date TIDM ISIN Code Shares in Issue Currency Net Asset Value NAV/per Share First Trust Vest Nasdaq-100 Moderate Buffer UCITS ETF - December 13.02.2026 QDEC.LN IE000GAKWFA7 450,002.00 USD 10,156,042.64 22.569 ...
-
First Trust Global Funds PLC UK Regulatory Announcement: Net Asset Value(s)
LONDON--(BUSINESS WIRE)-- Funds Date TIDM ISIN Code Shares in Issue Currency Net Asset Value NAV/per Share First Trust Indxx Europe Infrastructure UCITS ETF 13.02.2026 FTEI.LN IE000TIZ5AP4 50,002.00 EUR 1,032,498.85 20.649 ...
-
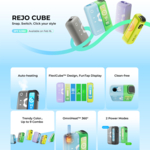
Weltpremiere des CUBE-Modulgeräts von REJO in Japan
TOKIO--(BUSINESS WIRE)--REJO, ein wegbereitender, weltweit tätiger Anbieter von HNB-Lösungen (Heat-not-Burn), stellte heute erstmals das neueste modulare HNB-Gerät, den REJO CUBE, in Japan vor. Der REJO CUBE bricht mit herkömmlichen HNB-Designnormen und bietet eine kühne neue Gerätoption mit einem trendigen Look und einem Dualmodus-Inhalationserlebnis. Das Gerät kommt am 16. Februar über die bedeutenden japanischen E-Kommerz-Kanäle in den Einzelhandel. Dieser Marktauftritt markiert den neuesten...

-
Ant Group Releases Ling-2.5-1T and Ring-2.5-1T, Evolving Its Open-Source AI Model Family
HANGZHOU, China--(BUSINESS WIRE)--Ant Group today announced the release of Ling-2.5-1T, its newest trillion-parameter large language model, and Ring-2.5-1T, the world’s first hybrid linear-architecture thinking model. Both models represent the latest evolution of the Ling 2.0 series unveiled in October 2025, and are now available under open licenses on Hugging Face and ModelScope. Ling-2.5-1T is the latest flagship in Ant Group’s Ling model series. It is designed to deliver higher reasoning eff...
-
Resecurity Showcases AI-Powered Cybersecurity Solutions at AI Everything MEA Egypt 2026
CAIRO--(BUSINESS WIRE)--Resecurity, a U.S.-based cybersecurity and intelligence company protecting Fortune 100 companies and government agencies worldwide, proudly exhibited at AI Everything MEA Egypt 2026, one of the region's most prestigious technology and innovation events. The event was held under the esteemed patronage of President Abdel-Fattah El-Sisi and hosted by the Ministry of Communications and Information Technology (MCIT), Egypt, in strategic partnership with the Information Techno...

-
Dunkin’ Joy in Childhood Foundation® Grants $1 Million to Feeding America® to Support Local Food Banks Nationwide
BOSTON--(BUSINESS WIRE)--The Dunkin’® Joy in Childhood Foundation® today announced a $1 million grant to Feeding America, the nation’s largest hunger-relief organization, to help provide food to families facing hunger in communities across the country. The funding will be distributed to local Feeding America partner food banks, strengthening their ability to meet rising demand and support neighbors experiencing food insecurity. “The Dunkin’ Joy in Childhood Foundation believes that joy starts w...

-
Havas Reports the Progress of Transactions Under Its Current Share Buyback Program
PARIS--(BUSINESS WIRE)--Havas reports the progress of transactions under its current share buyback program....
-
CRH plc UK Regulatory Announcement: Transaction in Own Shares
NEW YORK--(BUSINESS WIRE)-- 16th February 2026 CRH plc Transaction in Own Shares CRH plc (“CRH”) announces that on 13th February 2026 it acquired the following number of its ordinary shares (the “ordinary shares”) in the United States through CRH’s broker Santander US Capital Markets LLC. The ordinary shares acquired (by way of redemption) will be cancelled. Aggregate number of ordinary shares acquired Daily volume weighted average price paid Daily highest price paid per share Daily lowest pri...
-
REJO将CUBE模块化设备带到日本,开启全球首发
东京--(BUSINESS WIRE)--(美国商业资讯)-- 全球加热不燃烧(HNB)解决方案的先驱供应商REJO今日宣布,其最新模块化HNB设备REJO CUBE在日本全球首发。 REJO CUBE打破传统HNB产品的设计常规,推出一款风格大胆的全新设备,拥有潮流设计和双模式吸食体验,将于2月16日起在日本各大电商零售渠道发售。 此次发布是该品牌继2025年7月在日本推出REJO Mate Air后的最新举措,该设备凭借紧凑设计、顺滑口感和Puff Twice功能在当地成年用户中广受好评。 REJO CUBE体现了REJO始终坚持以用户体验为研发核心的理念,通过模块化设计带来设备搭配灵活性,借助交互功能提升用户参与感,最重要的是,在一个可适配市面上几乎所有可替换烟支的平台上,实现了先进加热技术的极致应用。 FlexiCube™模块化设计:全新智能灵活结构 为给成年用户带来设备的趣味性和多功能性,REJO CUBE提供三款潮流配色:薄荷绿、墨黑和蜜莓色。 这款产品采用磁吸式设计,将设备的两大模块——加热仓与可拆卸电池连接起来。通过搭配不同组件,用户可打造多达九种不同视觉组合,彰显个人...